


Testimony of Rohit T. Aggarwala Chief Climate Officer and Commissioner NYC DEP before the New York City Council Committee on Environmental Protection, Resiliency, and Waterfronts Oversight Hearing Air Quality and Last Mile Deliveries
February 28, 2025
Introduction
Good morning, Chair Gennaro and members of the Environmental Protection Committee. I am Rohit T. Aggarwala, Commissioner of the New York City Department of Environmental Protection (DEP) and New York City’s Chief Climate Officer. I am joined today by Julie Lubin, DEP’S Deputy Commissioner of Environmental Compliance. The bureau she oversees focuses on the agency’s air, noise, and asbestos work. I am also joined by Dawn Miller, my Senior Advisor.
I am delighted to have the opportunity testify on legislation that relates to delivery of one of our PlaNYC initiatives: to get polluting trucks off our streets.
Warehouses—especially the large operations that have proliferated with the growth of e-commerce—generate significant truck traffic, with meaningful negative impacts for air quality and health. These impacts are particularly acute in the underserved communities where many of these warehouses cluster.
We believe that New York City can address this source of pollution in a way that does not hamper our ability to move freight around the city. That’s the key innovation of a warehouse indirect source rule. It would require large warehouses meet air pollution reduction requirements, while offering a variety options for how to make these reductions.
Developing this policy can be a real partnership between City Council and the Administration. We memorialized our commitment to work together on this legislation in a letter back in May from First Deputy Mayor Maria Torres-Springer to Speaker Adrienne Adams as part of City of Yes for Economic Opportunity. This policy exemplifies how all of us can work together to keep New Yorkers safe from polluted air.
NYC’s Progress Improving Air Quality
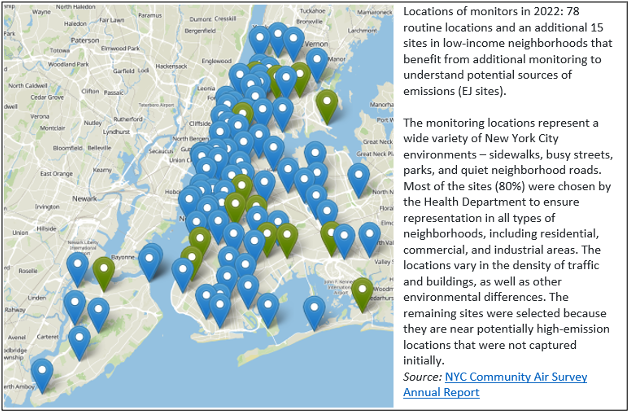
New York City has made tremendous progress improving air quality. We know this because we have one of the most robust air quality monitoring systems in the country: the NYC Community Air Survey (NYCCAS), which has been managed by the Department of Health and Mental Hygiene (Health Department) since 2008. NYCCAS uses a network of 85 air quality monitors across the city to measure key air quality indicators, providing neighborhood-specific data tracking neighborhood-level differences and changes over time in air quality within the five boroughs. NYCCAS generates estimates for five pollutants: fine particulate matter or PM2.5, Black Carbon (a specific type of PM2.5), nitric oxide and nitrogen dioxide, ozone, and sulfur dioxide. These data allow us to identify the most impactful pollution contributors in each area, report annually on criteria pollutant levels, and create publicly available data to support programs, policy development, community awareness, and research. We know that the three major emission sources driving local air quality levels and differences by neighborhood are commercial cooking, buildings, and traffic. This information shows us which communities bear the greatest burden of air quality-related health impacts and what interventions would be most impactful.
Improvements in New York City’s air quality have been driven largely by changes in vehicle and building fuels, as mandated by federal and local legislation. Over the past 20 years, we’ve seen a 60% decline in the pollutant PM2.5, or fine particulate matter, and a 40% reduction in the pollutant NO2, or nitrogen dioxide. The health impacts of these improvements have been clear: over that period, the number of asthma-related emergency room visits in NYC attributable to pollution have gone down by 50%. These trends are available on the Health Department’s Environment and Health Data Portal. Sulfur dioxide levels have plummeted to levels on par with those measured on Whiteface Mountain in the Adirondacks. This success is remarkable.
These improvements didn’t happen by accident. We got results when strong but achievable regulations were put in place by government.
With the support of the Council, and your legislation, Chair Gennaro, DEP has been leading efforts to reduce pollution around the city. First, buildings were required to start using natural gas or Number 2 fuel oil instead of the more polluting fuel options. The switch from Number 4 and 6 heating oil to Number 2 reduces fine particle emissions from building heating by 63% and reduces carbon dioxide emissions by about one million metric tons. Since last July, DEP has not issued renewals for boilers that use Number 4 Fuel Oil. By July 2027, there will be no more Number 4 fuel oil use in the city.
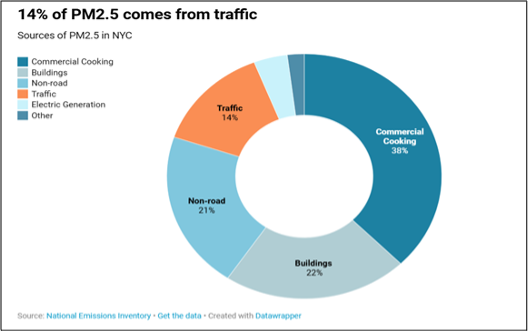
Following the data, we have also been focusing on reducing emissions from commercial char broilers and cook stoves. Cooking emissions make up almost 40% of PM2.5 emissions city-wide. Commercial char broilers alone emit about 1,400 tons of particulate matter per year.
As it did with dirty heating oil, the City Council directed DEP to reduce pollution from restaurants. Local Law 38 of 2015, set new standards for new commercial cook stoves and char broilers that have applied to all such equipment installed since 2016. The law also required DEP to mandate limits on pre-existing cookstoves and char broilers. These rules were delayed by the pandemic, but last year, DEP enacted a rule to set these same standards for cook stoves installed before 2016. This year, we are enacting a rule to reduce emissions from certain commercial char broilers that were installed before 2016. In both cases, the rules apply only to small number of establishments and the rules include opportunities for variances for establishments that would genuinely face a hardship in complying.
Gaps in NYC’s Progress Improving Air Quality
Despite the dramatic improvements we have seen citywide, our current levels of air pollution still cause asthma, cardiovascular disease, lung disease, and strokes. In New York City, air pollution from all sources still contributes to 2,000 deaths and 5,150 emergency department visits and hospitalizations for respiratory and cardiovascular disease each year.i Air pollution from traffic alone contributes to an estimated 320 premature deaths and 870 emergency department visits and hospitalizations each year in New York City.ii
Further, these are increasingly concentrated in a few neighborhoods. Using NYCCAS data, the Health Department has done essential research to identify air quality related health inequities across neighborhoods. They found that the people who suffer the most from air pollution are those who live in neighborhoods such as the South Bronx, Harlem, the North Shore of Staten Island, East New York, and Brownsville. The reality of pre-existing health conditions and reduced access to health care make air pollution a much greater threat in these neighborhoods compared to wealthier parts of the city.
While charbroiling in restaurants remains the largest single local source of particulate matter citywide, truck traffic remains a key culprit in many of these neighborhoods that suffer the most.iii
Air pollution levels from all traffic sources are about 50% higher in high poverty neighborhoods than in low poverty neighborhoods. The number of hospitalizations and ED visits related to pollution from traffic are highest in the poorest neighborhoods. iv
The Health Department has found that the density of warehouses—a stronger indicator of freight industrial use that generates truck traffic—explains the difference in pollution levels between neighborhoods much more clearly than industrial zoning generally. Areas with a higher density of warehouses, such as Newtown Creek in Queens, near JFK airport, Sunset Park in Brooklyn and Hunts Point in the Bronx, have higher levels of truck-related air pollution. v
Techniques for Addressing Air Pollution from Freight
As concerned as we are about the impacts of large warehouses and the traffic they generate, freight is not the enemy. We need to move goods – we just need to move them smarter.
About 90% of New York City’s goods move via trucks—far higher than the national average of 70%. More than 80% of New Yorkers receive at least one package at home each week; 18% receive packages on four or more days per week. By 2045, New York is expected to accommodate a 43% increase in freight—430 million tons, up from 300 million today.
This highlights the importance of New York City’s strong commitment to mitigating and reversing the negative impacts of the growth in freight deliveries, especially in environmental justice communities. Our strategic climate plan, PlaNYC: Getting Sustainability Done underscores this dedication with a suite of five initiatives to explicitly “get dirty trucks off our streets, ” including expanding zero-emission delivery methods, installing truck charging infrastructure, and strengthening policies to reduce idling.
PlaNYC builds off existing commitments to green the movement of goods made by both the NYC Department of Transportation (DOT) and the NYC Economic Development Corporation. Delivering Green, Freight NYC, and Delivering New York all articulate the importance of reducing emissions from the freight industry. Key commitments related to advancing low and zero emission vehicles from this suite of reports include shifting last-mile freight deliveries from trucks to small, sustainable delivery methods and expanding the Clean Trucks Program. The Clean Trucks Program is a federally funded $30 million rebate incentive program designed to accelerate the deployment of cleaner trucks in industrial business zones located near environmental justice communities that have been historically subjected to disproportionate amounts of diesel exhaust emissions.
We’ve been delivering on these plans, making significant strides in promoting safer, more sustainable, and efficient freight systems. Through the Clean Trucks Program (NYCCTP), up to 702 trucks have been funded, 672 of them as replacements, and DOT has expanded the program to Industrial Business Zone fleets citywide. Starting this March, NYCCTP will be using the remaining USEPA-VW Settlement funding to support zero emission vehicles exclusively.
Last year, NYC DOT created new rules to make it easier for delivery companies to adopt electric cargo bikes, a less-polluting alternative to large delivery trucks. New York City has the largest cargo bike program in the country. In 2022, cargo bikes made more than 130,000 trips and reduced over 650,000 metric tons of CO2 emissions. NYC DOT is also working with the private sector to establish delivery hubs called microhubs, which provide dedicated spaces for truck operators to transfer deliveries onto smaller, more sustainable modes of transportation, including e-cargo bikes, handcarts, and smaller electric sprinter vans. The initial microhub pilot program will include up to 36 locations, with the first five locations launching this year on the Upper West Side, under the BQE in Clinton Hill, and in Greenpoint, Brooklyn.
DOT also launched the LockerNYC Pilot, which centralizes delivery points to reduce truck traffic and package theft. They have expanded efforts to shift more deliveries to overnight hours, when trucks can spend less time sitting in traffic, announcing new financial incentives as part of the Off-Hour Deliveries Program. This program has over 1,000 locations so far, and DOT recently launched a $6 million incentive program to provide small businesses with tools and technologies to allow for overnight deliveries. The program aims to add 5,000 off-hour delivery locations by 2040, shifting 62,000 trucks away from peak hours.
The New York City Economic Development Corporation and NYC DOT also continue to work on a Blue Highways program to reactivate marine infrastructure, helping to shift deliveries from larger trucks to our waterways. Today, only 8% of our freight moves by water. The City and its partners in the federal and state governments are investing $368 million to modernize and electrify the Brooklyn Marine Terminal, reimagining the 122-acre site as a key node in our Blue Highway Network. From Hunts Point to Lower Manhattan, the City is working to better accommodate freight arrivals on our piers and reimagining how our waterfront assets can be used in the future, including adding capacity to our Downtown Manhattan Heliport and passenger ferry landings so they can double as maritime and last-mile hubs. The City is working with the private sector through the Blue Highway RFEI to identify opportunities to reactivate waterways, including pilots to test how we can use our existing passenger ferry network and infrastructure to move goods up and down the East and Hudson River.
There are also opportunities to reduce pollution by shifting more freight to rail. New York City’s freight network includes over 90 miles of rail freight lines and nine rail yards. These assets provide significant environmental, efficiency, and safety potential. However, efforts to shift back towards rail face challenges. The trend has been away from rail and towards trucks over the past several decades. In 1972, Brooklyn and Queens moved 73,000 carloads per year. In 2017, just 17,000 carloads were delivered to Brooklyn and Queens. Although much of this network is controlled by non-City entities, such as New York State or the Port Authority, the City owns three freight rail facilities: the Brooklyn Waterfront Rail System in Sunset Park, the Staten Island Rail Right of Way on the north and west short of Staten Island, and the rail facility in Hunts Point Food Market. These freight rail facilities are operated by private rail operators. The main freight line linking the City and Long Island is through the Bay Ridge Freight Line, which is owned by the State of New York.
Most rail freight infrastructure in New York City was developed in the early 20th century. Therefore, a big focus of the City’s is maintaining our facilities in a state of good repair. Rail can be an environmentally and fiscally efficient way to reduce polluting truck trips, and the City’s own actions demonstrate its potential: the Department of Sanitation is the biggest user of freight rail in New York City, using it to export waste via rail. To support business’ use of freight rail, the City is continuing to invest in our rail terminals: the 65th Street Rail Yard/1st Avenue Rail and the Arthur Kill Lift Bridge. The Arthur Kill Lift Bridge, which is part of the Staten Island Rail Right of Way, was recently awarded a $17.2 million Federal Railroad Administration grant for capital upgrades on this more than 60-year-old bridge.
There has been significant recent focus by the City on the Blue Highways program. The waterfront land the City controls, and can therefore program, supports marine transport. As a city of islands, it’s no surprise marine transport is an area in which the private sector sees opportunities. There is potential for synergy between freight rail and the Blue Highways program, and the City is exploring potential connections at City-owned rail assets in Sunset Park, Staten Island, and Hunts Point.
We know shifting trips away from trucks altogether, to other modes like freight rail, is a big focus of yours, Chair Gennaro. Policies like an indirect source rule support this important shift. When there are regulations requiring warehouses to reduce their pollution, the freight system has added motivation to explore alternatives like freight rail and marine transport.
Warehouse Industry Overview
Because of the relationship between the warehouse industry, freight traffic generation, and air pollution, we have done a deep analysis of the NYC warehousing industry.
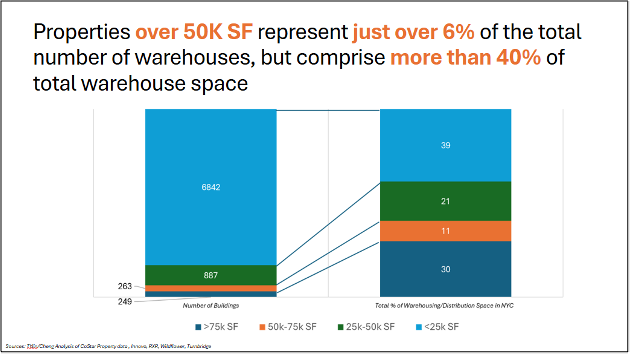
NYC has over 8,000 warehouses. Most NYC warehouses are relatively small—6,800, or about 85%, are under 25,000 square feet. A subset are large—about 500 warehouses are over 50,000 square feet. While just 6% of the total number of warehouses, these large warehouses comprise more than 40% of total warehouse space. This means a policy focused on the largest players could make a big impact on our air quality.
NYC’s largest warehouse operators range from parcel delivery companies like Fedex and UPS to direct-to-consumer companies like Amazon, IKEA, and FreshDirect. They also include large suppliers to retailers, like Pepsi-Cola, Restaurant Depot, Manhattan Beer, and Coca-Cola.
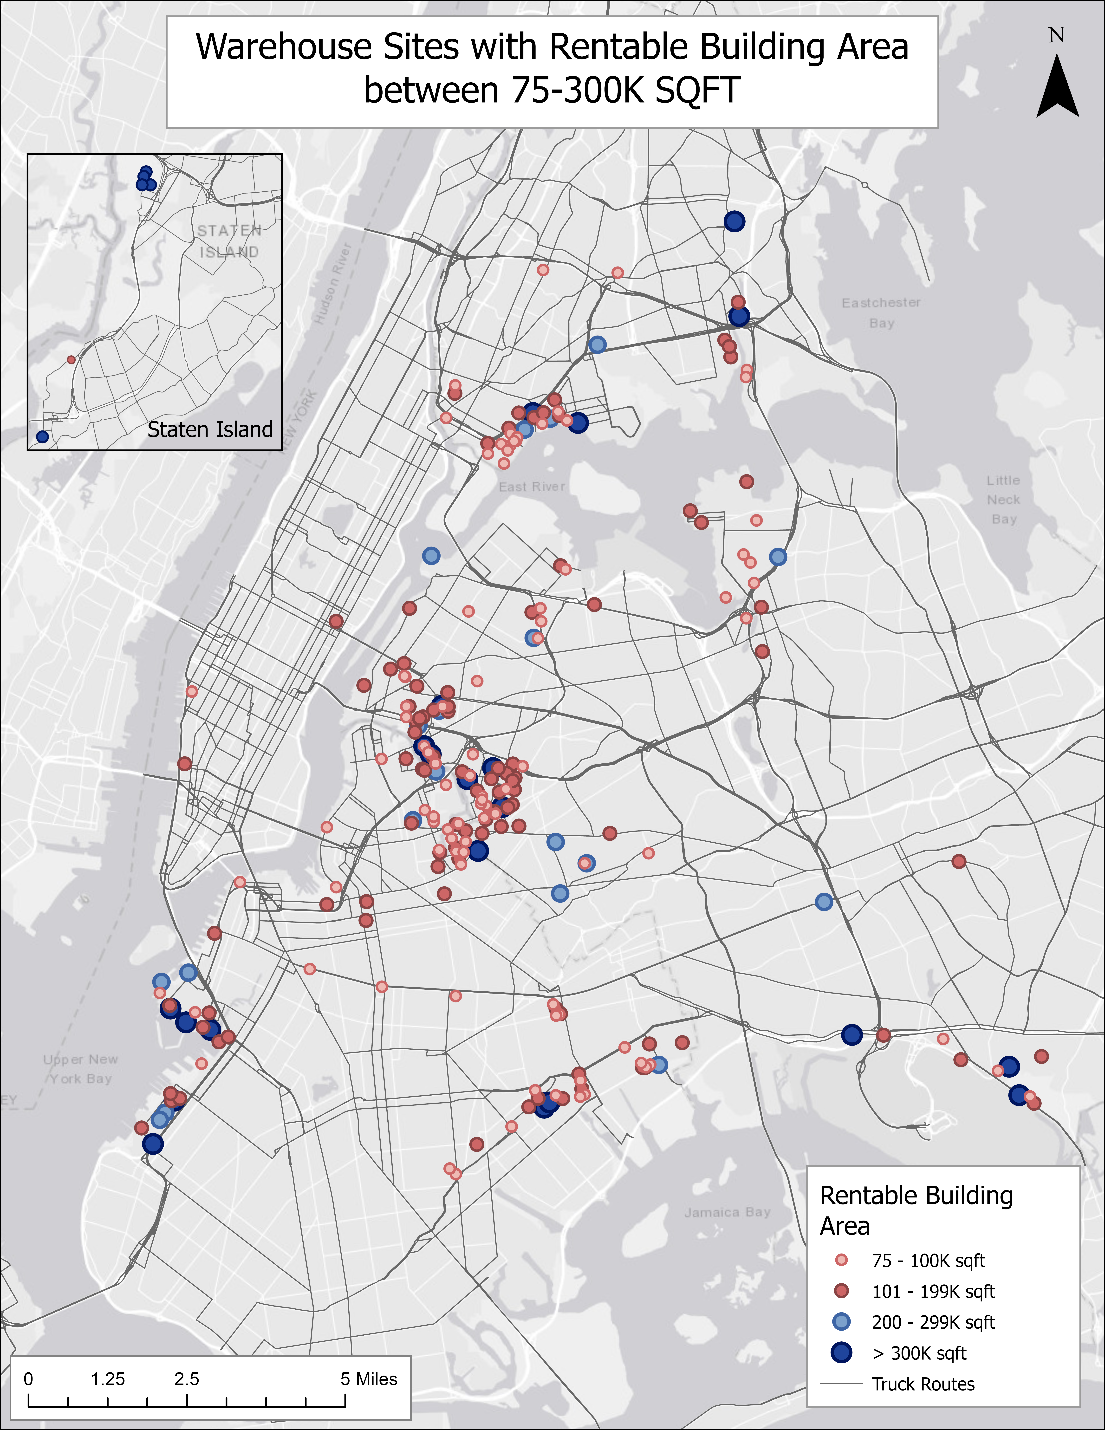
The biggest concentrations of large warehouses are in Brooklyn, including Red Hook and Sunset Park, Maspeth and Long Island City in Queens, and the South Bronx. Red Hook has nine warehouses over 100,000 square feet. Sunset Park has ten. Maspeth has 20, and the South Bronx has 13. Approximately 75% of these largest warehouses are in Brooklyn, the Bronx, Maspeth, and Long Island City.
We also know warehouses are generating a large number of truck trips. National data estimates a 75,000-square foot warehouse generates approximately 45 truck trips per day. Over the course of a year, this adds up to an estimated 11,700 truck trips from just one warehouse this size. We could expect these numbers to be higher in New York City, where many of our warehouses are used intensively. With large warehouses clustering as much as they do, these trips and their impacts really add up.
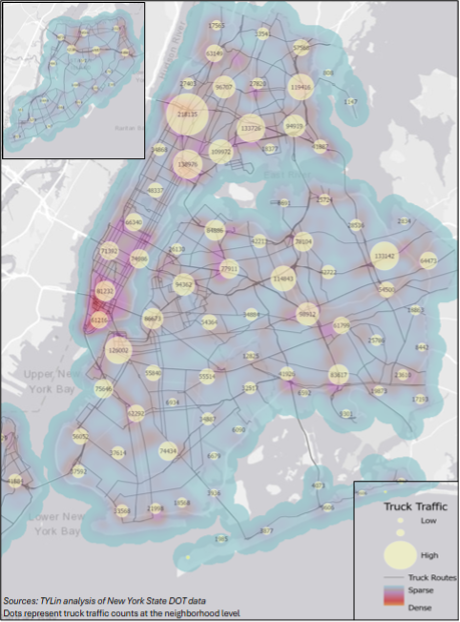
Some of the highest densities of freight traffic in NYC are in Lower Manhattan, the South Bronx, Washington Heights, and Downtown Brooklyn. Patterns align with the highway network, concentrations of warehouses, and concentrations of commercial and residential recipients of goods.
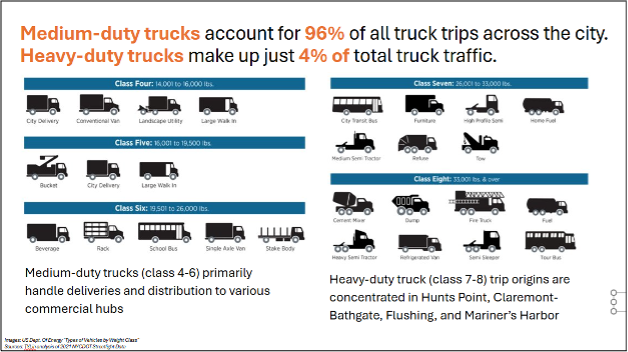
The largest, heavy-duty trucks are only about 4% of truck traffic. However, these are some of the highest-polluting vehicles, and their traffic concentrates near some of our most vulnerable neighborhoods. Ninety-six percent of trucks driving around NYC are medium-duty. This creates a real opportunity—because medium-duty trucks have relatively low energy needs, many of them can complete their routes without charging and get all the charge they need overnight, while parked.
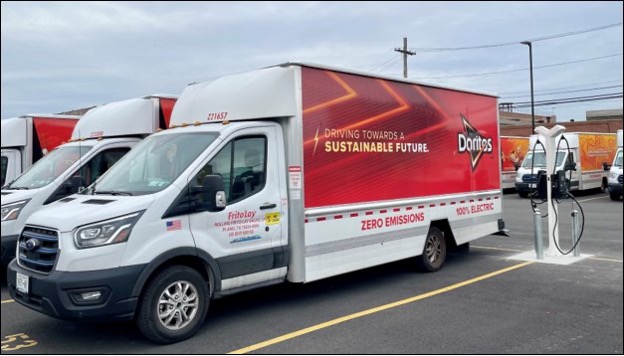
The Frito Lay warehouse in Ridgewood, Queens is a great example of a New York City operation that is leading the way in electrifying its fleets using a combination of level 2 and fast charging.
Our research has also confirmed what many New Yorkers have been feeling: The most significant trend in New York City’s industrial real estate market during the past ten years has been the construction of large-scale distribution centers developed in response to the rise in e-commerce. In the past 10 years, 35 traditional warehouses and distribution centers over 75,000 square feet were either newly constructed or completely renovated in New York City. Of these, 20 were very large, tallying at least 250,000 square feet. This more than doubled the number of buildings of that size in operation in the five boroughs. This includes several warehouse facilities with multiple stories – a concept that did not exist in the U.S. until 2018.
NYC’s warehouse industry is diverse in terms of operating arrangements. While some warehouse operators own their buildings, many operators lease. Some producers operate their own fleets, and others outsource to “third party logistics ” providers like C.H. Robinson, J.B. Hunt, and Ryder. Some of the largest companies, like FedEx and UPS, often control most aspects of the supply chain.
This is important because it means a one-size-fits all policy would be difficult to effectively design. A policy that gives operators choice for how to reduce their pollution is most likely to yield the best results.
There are a variety of ways in which NYC presents a unique warehousing environment. As we all know, land costs are high. In 2024, warehouse space in New York City averaged $28.21 per square foot. Nationwide, it averaged $8.31. Labor costs here are also high, averaging $22.43 per square foot of warehouse space in New York City as compared to $16.95 nationwide. Operators nevertheless locate here, for their proximity to millions of customers and vibrant, diverse and qualified workforce. In contrast to New Jersey or Pennsylvania, both of which host significant warehousing, warehousing in NYC is more directly focused on serving the needs of local residents and businesses.
Understanding these factors is important for designing an indirect source rule because they help us project how the warehousing industry might respond to additional regulations. Without a doubt, we want to avoid unintended consequences that could undermine these environmental benefits. So, understanding industry incentives and potential responses will help us calibrate the indirect source rule to achieve desired impacts.
A Warehouse Indirect Source Rule: A New Tool to Address Air Pollution
A warehouse indirect source rule is a strong policy tool the City can use to address air pollution from freight movement. It’s neatly at the intersection of the longstanding need to green our freight industry and the more recent growth and recognition of acute impacts in neighborhoods with concentrations of warehouses.
An indirect source rule also isn’t exactly a kitchen table term, so it needs some explanation. At a high level, an indirect source rule reflects the fact that a facility generates pollution both directly and indirectly. For example, the direct air pollution from a warehouse might come from the systems that heat and cool the warehouse building. The indirect air pollution from a warehouse comes from the vans and trucks that are attracted to the facility—and therefore the warehouse is indirectly generating the pollution leaving these trucks’ tailpipes.
The most significant indirect source rule in place today is Southern California’s 2021 warehouse indirect source rule. In that program, warehouses are assigned a number of points they must earn that are proportionate to how much the vehicles visiting them pollute. Each year they must earn points equal to their compliance obligation. They have a menu of options for earning points. Items on the California menu include buying zero emissions or near zero emissions trucks, doing trips in these less-polluting vehicles, and installing EV charging.
Developing a New York City version of an indirect source rule presents a unique opportunity to clean our air. Federal law prevents cities, including New York City, from acting unilaterally to set fuel economy standards. However, an indirect source rule is something New York City can put in place through our own independent authority via the Air Code enforced by DEP.
An important element of an indirect source rule is that it could apply to both new and existing large warehouses. There is also a separate, but related, proposal that the Department of City Planning is advancing: a last-mile facility zoning special permit. This would apply to new last-mile warehouses. That special permit would focus on the siting and opening of new last-mile warehouses. In contrast, the indirect source rule proposal could be broader in scope, impacting existing and future large warehouses and the pollution they create each year.
Our Vision for a New York City Warehouse ISR
As I mentioned earlier, creating a warehouse indirect source rule would be a realization of a PlaNYC goal to get polluting trucks off our streets. We were proud to join Council in committing to advance this policy when we passed City of Yes for Economic Opportunity last year. We are therefore very pleased to be having this hearing today. We look forward to working with Council to develop this policy.
We envision a warehouse indirect source rule in which the City’s largest warehouses are required to earn a number of points each year that is proportionate to the number of vehicle trips made to their warehouse. Trips made in heavy-duty trucks, which pollute the most, would be weighted more heavily than trips made in smaller vehicles. All motor vehicles making deliveries would count towards a warehouse’s compliance obligation.
Large warehouse operators would have a menu of options they could mix and match to meet their compliance obligation. This would include points for both acquiring and using zero-emission and near zero-emission vehicles, cargo bikes, and EV chargers. It would also include menu items beyond delivery fleet conversion. This could include installing anti-idling technology in existing vehicles, electrifying yard trucks or forklifts, or investments in tree preservation or planting.
We have taken inspiration from the Southern California warehouse indirect source rule, which some of you are familiar with, but we believe a New York City policy should reflect both New York City priorities and assets. One of our assets is density. Density allows many deliveries to be done through cleaner modes like cargo bikes. Another asset is our waterways. Our waterways present a significant opportunity to move large volumes of freight without logging as many truck miles. Our rail network is also an asset we hope the freight industry can leverage even more as an alternative to trucks.
Our indirect source rule policy can align with another PlaNYC initiative: if you’ve got to drive, drive electric. An indirect source rule can push operators to use boats, rail, and cargo bikes to transport goods. When a truck is needed to get the job done, an indirect source rule can push the operator to use a lower-polluting truck.
As you’ve heard throughout this testimony, an indirect source rule need not apply to all warehouses to be effective. New York City’s 500 largest warehouses account for more than 40% of total warehouse space. As we see it, the rules should focus on large warehouses, which generate the most pollution and likely have the greatest capacity to make investments to reduce their pollution. Facilities that are primarily doing manufacturing but have small spaces used for warehousing also should not be subject to the same rules. We can design the policy to have a large enough impact that we see air quality improvements without burdening small operators or New York City manufacturing.
One helpful feature of this policy is that it naturally scales with the size of the operation. A warehouse that reduces its trips by shifting trips to rail, water, or cargo bicycle, or combines two half-empty loads into a single truckload, would naturally see its compliance obligation decrease.
A diverse points menu is important to providing the diverse set of warehouse operators in NYC with options that work for them, whether they own and operate their own fleets or outsource that function to third parties. It also reflects the fact that some investments take time and planning, so a warehouse owner might choose certain compliance options in early years as it plans for the long term.
We see a lot of promise in the concept of a custom plan. Although we expect most operators would find plenty of options on the points menu, custom plans would provide an opportunity for a warehouse operator to propose pollution reduction measure that are not yet on the points menu. One benefit of welcoming custom plans is providing a venue for innovation or partnerships that can drive major investments. Technology in this industry can evolve quickly, and this policy should credit new, efficient investments. A second benefit is that a custom plan can accommodate unique and site-specific actions that support other City priorities. For example, a warehouse operator making Blue Highways investments could demonstrate the pollution reduction value of those investments and earn points for them. Custom plans could also be used by warehouse operators that want to make investments to support other key initiatives, such as microhub development, off-hour deliveries, or EV fleet resiliency.
Overall, we’re interested in developing a policy focused on large warehouse operators, defined broadly. We are considering whether and how an indirect source rule should apply to warehouse operators providing fresh food. This is such a critical resource for New Yorkers. We want to make sure access remains strong and can get stronger.
Intro 1130
Now, turning to the specific bills up for a hearing today. I’ll start with Intro 1130, which would direct DEP to promulgate an indirect source rule. We are grateful to Council Members Aviles, Brooks-Powers, and the other bill cosponsors for introducing this legislation and to Chair Gennaro for calling this hearing. As you can tell from my testimony, we are strongly supportive of creating a warehouse indirect source rule and look forward to working with Council on language.
One area in the bill we’d like to discuss is definition of a warehouse. We share a goal of focusing on large warehouse operators. The language in the draft bill seems to be identifying a smaller universe of warehouse operators than we had envisioned this policy would apply to. Of the 512 total warehouses we identified that are over 50,000 square feet, only 80 are distribution centers. A rule limited to distribution centers would likely be significantly less impactful than a rule addressing a larger universe of large warehouses. We would like to work together to find a warehouse definition that includes all operations whose truck traffic is significantly impacting our air quality, while not including small operators.
I’ll also note that this legislation must go through the formal City Environmental Quality Review process, or CEQR, before it can be brought to a vote. CEQR is the process by with City agencies determine what, if any, effect a discretionary action they approve may have on the environment. CEQR considers a variety of technical areas, including socioeconomic conditions, public health, transportation, energy, and air quality. It is a public process. The public is invited to provide input in this process and findings from this analysis are shared with the public. DEP has been funded just under $2.2 million for CEQR for this policy and is preparing to begin that process in the coming months. This process typically takes at least a year, so we expect it will be completed in 2026. We are looking forward to Council and stakeholder participation in that process.
Intro 107
I’ll now turn briefly to Intro. 107, which would require specific air monitoring on heavy-use thoroughfares. The harmful impacts of traffic pollution on air quality and public health are well known and a specific focus of the City’s air quality efforts. Traffic-related pollutants, such as PM2.5 and NO2, are associated with negative health effects, including asthma, strokes, and cancer. We appreciate this bill’s focus on traffic pollution, and we recommend changes to its approach to the issue.
Intro. 107 would require significant and costly air quality monitoring on almost all city streets (97% of NYC streets meet the 100,000 annual vehicle threshold). We do not think this new monitoring system is necessary or a good use of City resources, because the Health Department and the New York State Department of Environmental Conservation (DEC) already maintain air quality monitoring systems around the city.
As described earlier, the Health Department’s New York City Community Air Survey (NYCCAS) is the largest ongoing urban air monitoring program of any U.S. City and has provided us with rich data. NYCCAS data has been the basis for major policy initiatives, led by City Council legislation, such as the phaseout of dirty heating oil and the focus on restaurant emissions. We already know that traffic is a major source of pollutants, and we know where the traffic emissions are concentrated, thanks to traffic data collected by regional partners, including NYCCAS.
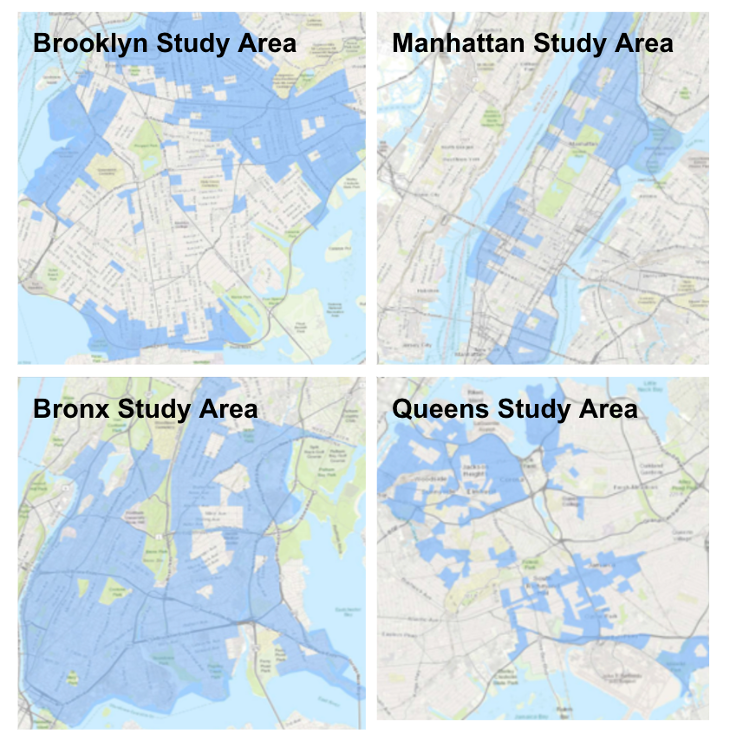
Additionally, DEC maintains their own air monitoring systems around the city. Recently, DEC has launched a statewide Community Air Monitoring (CAM) Initiative that has collected street-level pollution data from ten disadvantaged communities around the state. Four of these communities are in New York City: sections of Brooklyn, the Bronx, Manhattan, and Queens.
DEC collected these street-level data for a year and are now using that data to develop air pollution mitigation strategies. They expect to issue a Final Report of Recommended Air Pollution Reduction Strategies later this year. We look forward to the results of their initiative.
Finally, the indirect source rule would require warehouses to track the number and type of trucks that come into their warehouses every day. With that count, we can accurately determine the amount of pollution that the trucking activities introduce to the area.
We strongly believe that we do not need an additional data collection system. We have the information we need to create data-informed policies. At this point, allocating resources toward effective implementation of such policies, like the indirect source rule, and other pollution reduction strategies will be more protective of New Yorkers than collecting more data. We would like to work with the sponsor to revise this legislation with that priority in mind.
Conclusion
In closing, I want to reiterate my and my colleagues’ thanks to the committee for your attention to this issue, and for the opportunity to testify about these today. I look forward to your questions.
i https://a816-dohbesp.nyc.gov/IndicatorPublic/data-stories/traffic-and-air-pollution/
ii https://a816-dohbesp.nyc.gov/IndicatorPublic/data-stories/traffic-and-air-pollution/
iii https://climate.cityofnewyork.us/wp-content/uploads/2024/04/EJNYC_Report_FIN_20240424.pdf
iv https://a816-dohbesp.nyc.gov/IndicatorPublic/data-stories/traffic-and-air-pollution/
v NYC Community Air Survey Annual Report