


Provisional Birth and Death Data
The NYC Health Department collects data on every birth and death that happens in New York City. These data, called vital statistics, provide a fundamental understanding of birth trends, death trends, and population health in New York City.
The data on this page are provisional data, which means that the numbers may change as the Health Department continues to process the data. Publishing provisional data allows the Health Department to share data faster, before it is finalized.
Final data are available in the Annual Summary of Vital Statistics and on EpiQuery.
Go to:
Births by Demographics | Birth Characteristics | Care Characteristics | Deaths | Infant Mortality
Birth Data
Data on births come from birth certificates. The three birth sections below include quarterly provisional data on demographics, birth characteristics, and care characteristics.
Births by Demographics
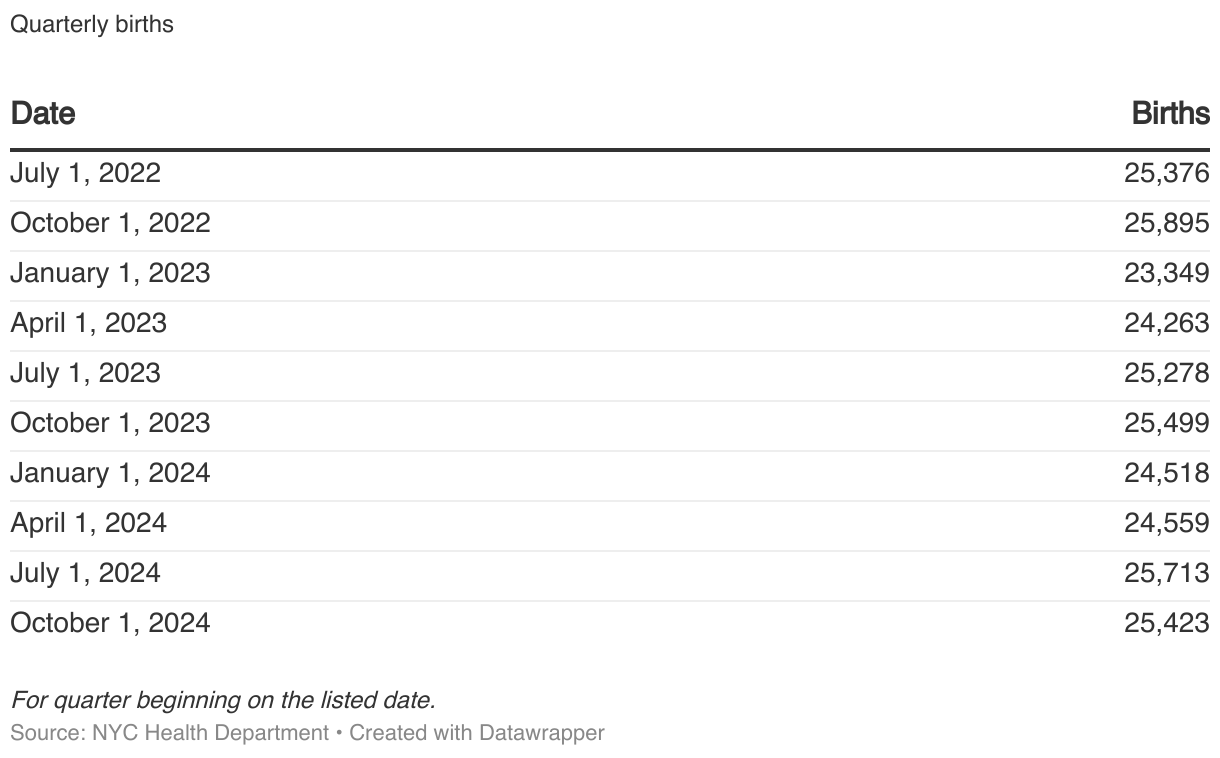
Total births
Each quarter, there are about 25,000 births in New York City. They have a slight seasonal pattern.
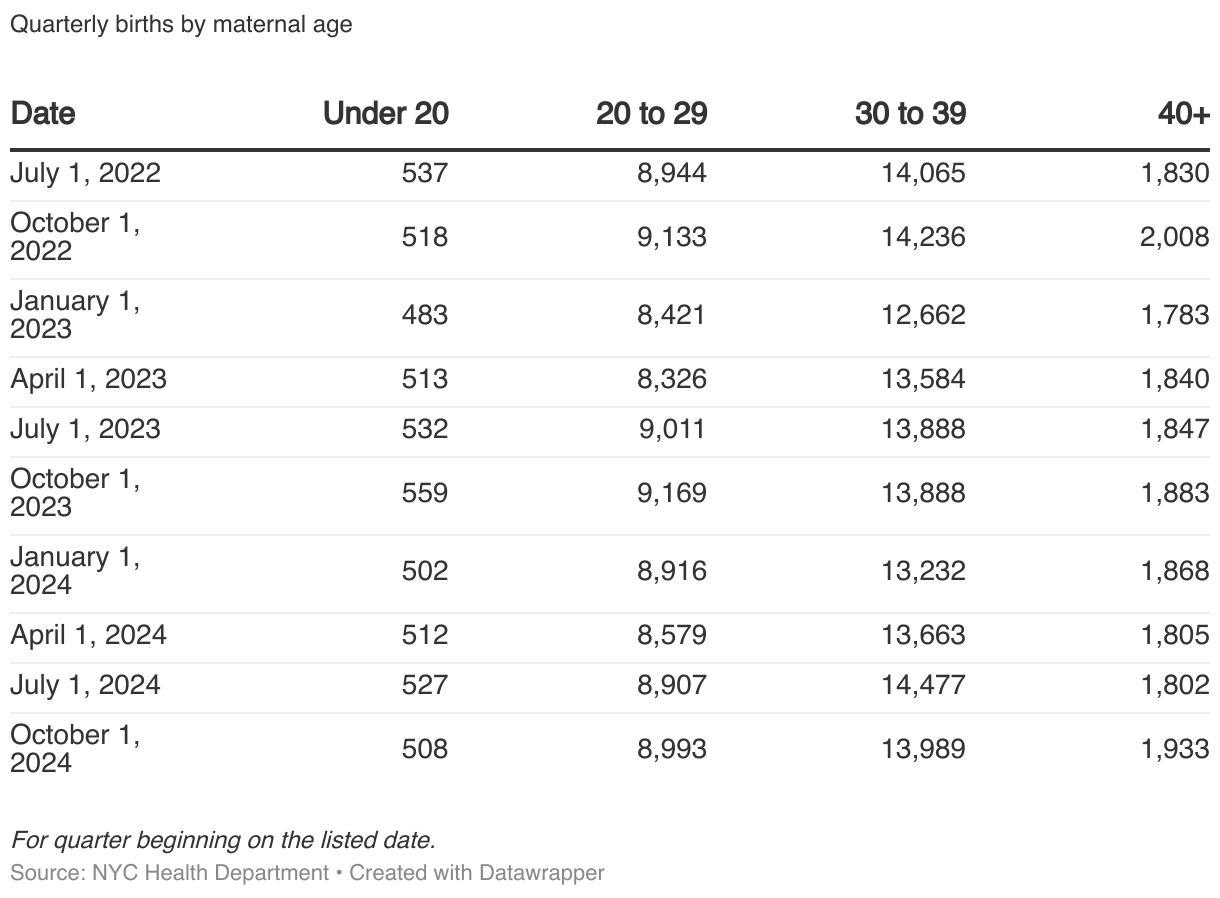
Births by maternal age
These counts (the number of events) of births by maternal age show how many births happened in each age group. Counts should not be used to make comparisons between groups, since the population sizes are not the same. For example, the group with the most births may not have the highest birth rate. Fluctuations in counts do not necessarily show a meaningful trend.
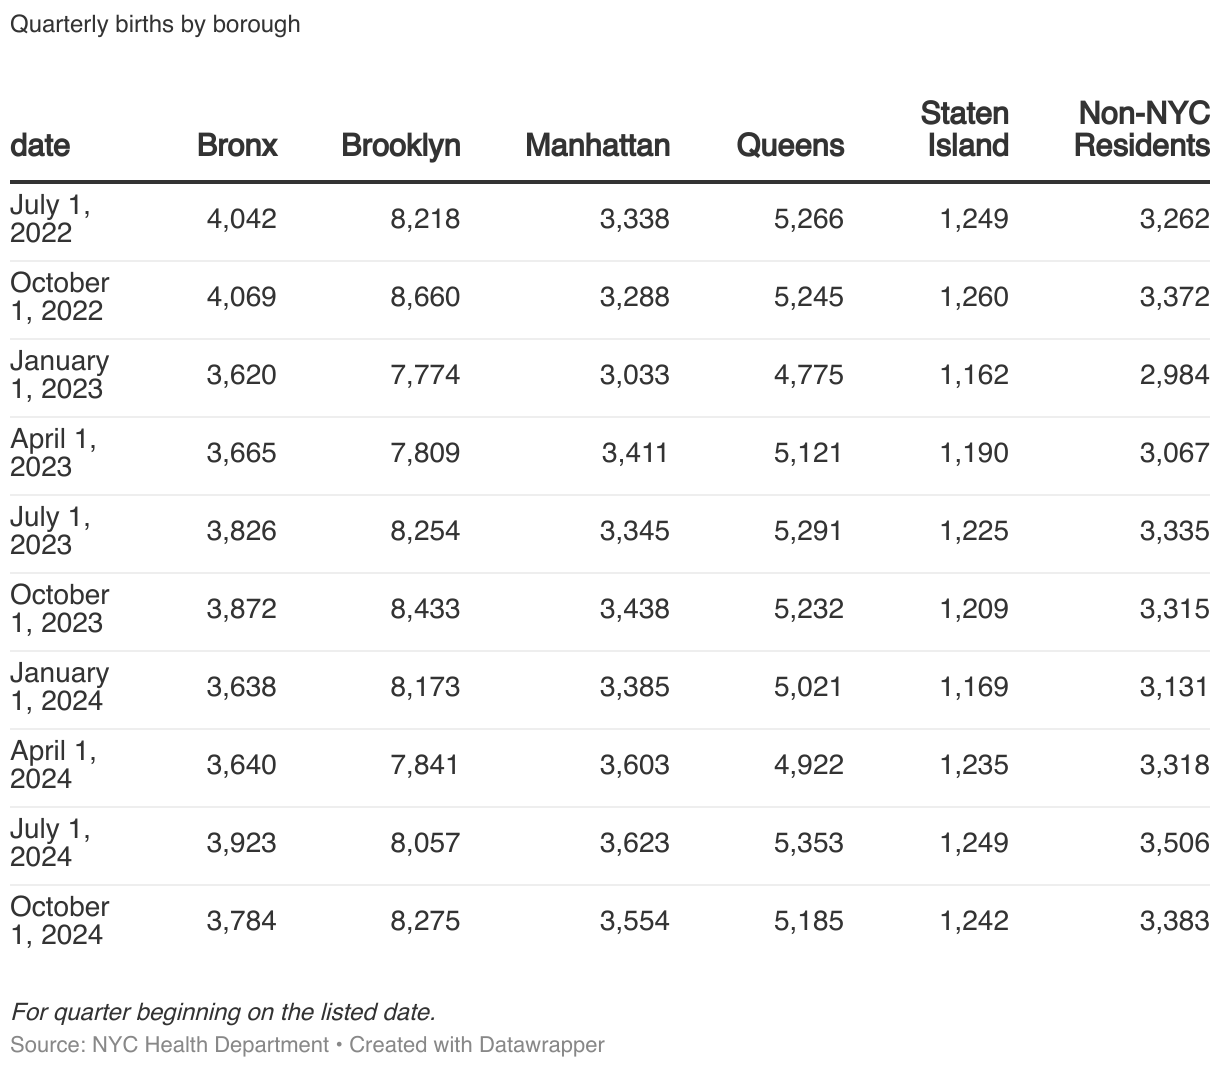
Births by borough
These counts (the number of events) of births by borough show how many births happened for residents of each borough. Counts should not be used to make comparisons between groups, since the population sizes are not the same. For example, the group with the most births may not have the highest birth rate. Fluctuations in counts do not necessarily show a meaningful trend.
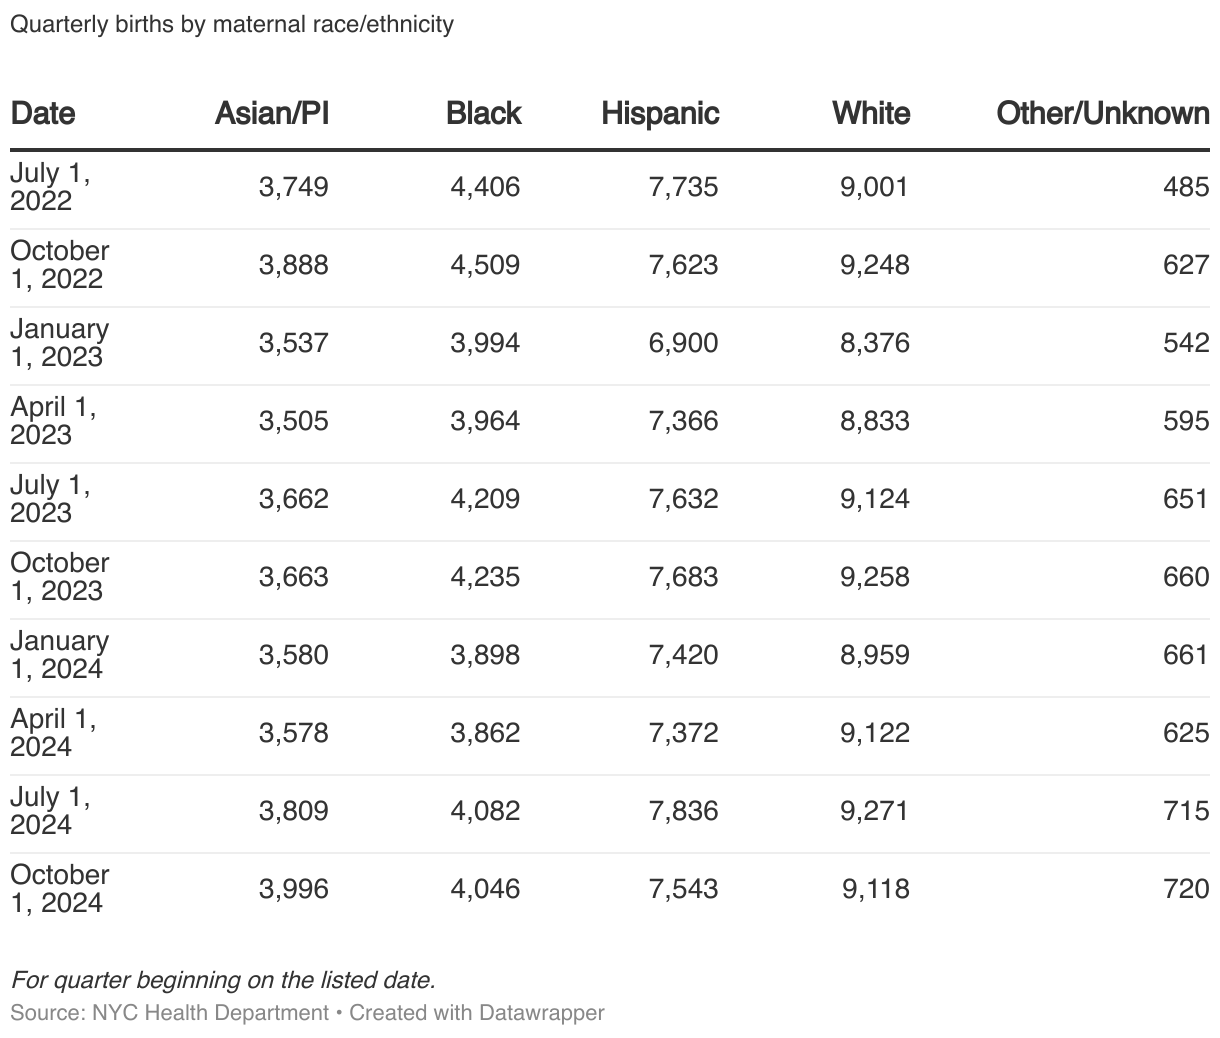
Births by maternal race/ethnicity
These counts (the number of events) of births by maternal race/ethnicity show how many births happened in each racial/ethnic group. Counts should not be used to make comparisons between groups, since the population sizes are not the same. For example, the group with the most births may not have the highest birth rate. Fluctuations in counts do not necessarily show a meaningful trend.
Birth Characteristics
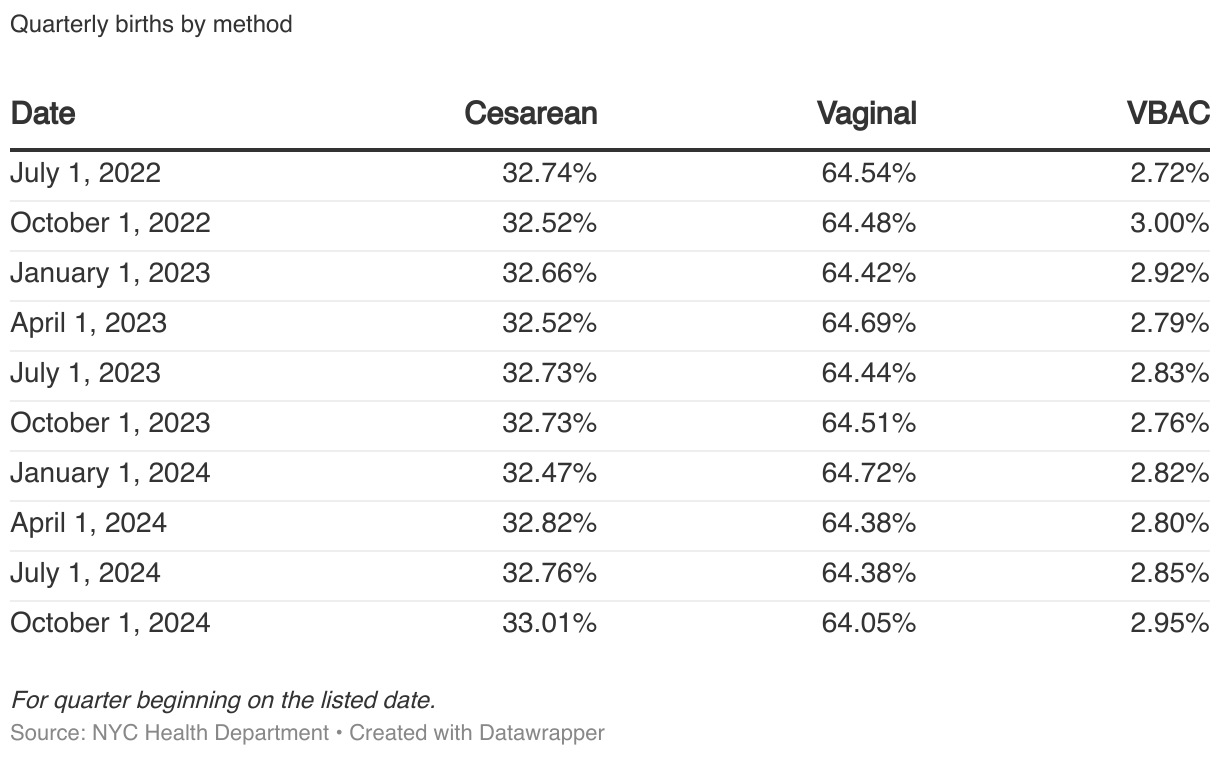
Births by method
Usually, about two-thirds of births in NYC are vaginal births. Other methods include cesareans (c-sections) and vaginal birth after cesarean (VBAC), which is when somebody gives birth vaginally after previously giving birth by c-section.
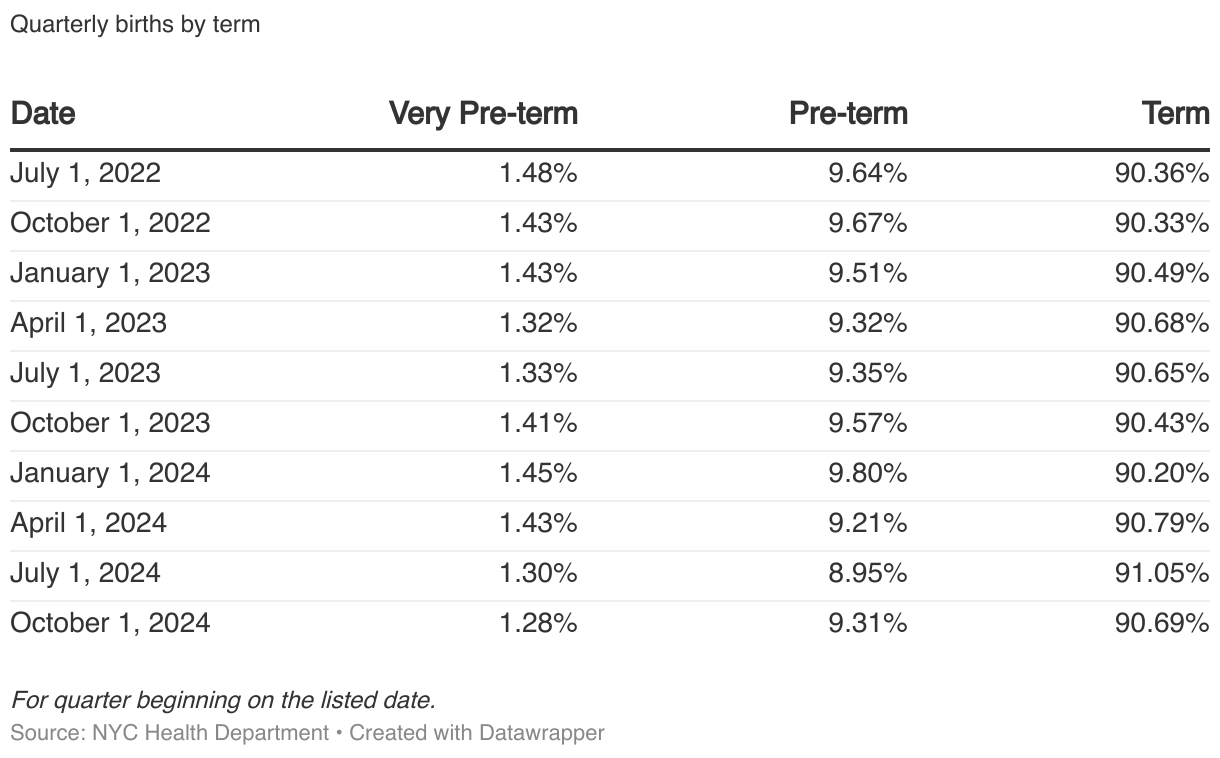
Births by term
About 90% of births in NYC are babies born at term, which is at 37 weeks of gestation or older. Pre-term births are when the baby is less than 37 weeks of gestation. A subset of pre-term births are very pre-term births, which are when the baby is less than 32 weeks of gestation at time of birth. Generally, babies have better outcomes when they are born at term.
Births by birthweight
About 90% of babies born in NYC have a normal birthweight—2,500 grams and above, which is about 5.5 pounds. Babies are considered low birthweight if they weigh less than 2,500 grams. A subset of low birthweight babies are considered very low birthweight, at less than 1,500 grams, or 3.3 pounds.
Births by coverage
Births are categorized as covered by Medicaid or non-Medicaid. Usually, a little more than half of births are covered by Medicaid.
Care Characteristics
These indicators of health and care provided during pregnancy or after birth are key to understanding birth outcomes.
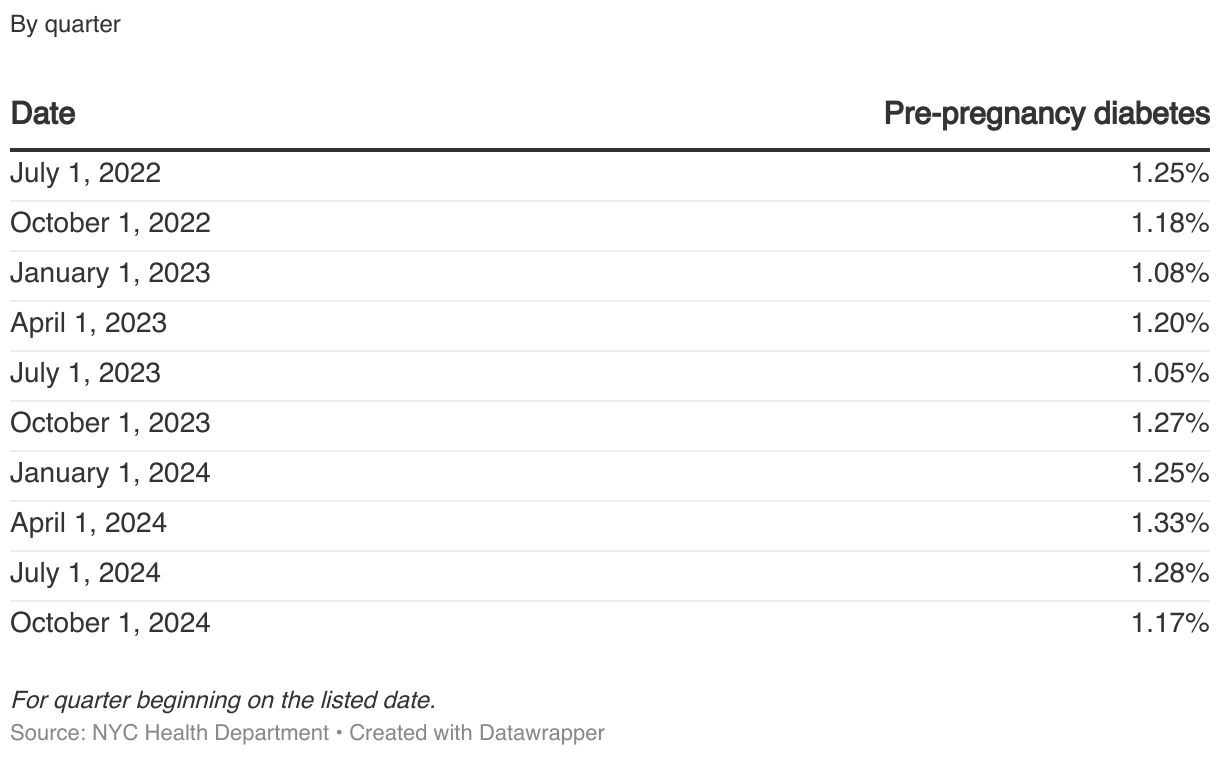
Pre-pregnancy diabetes
Usually, over 1% of mothers have pre-pregnancy diabetes, which can be a risk factor for poor birth outcomes.
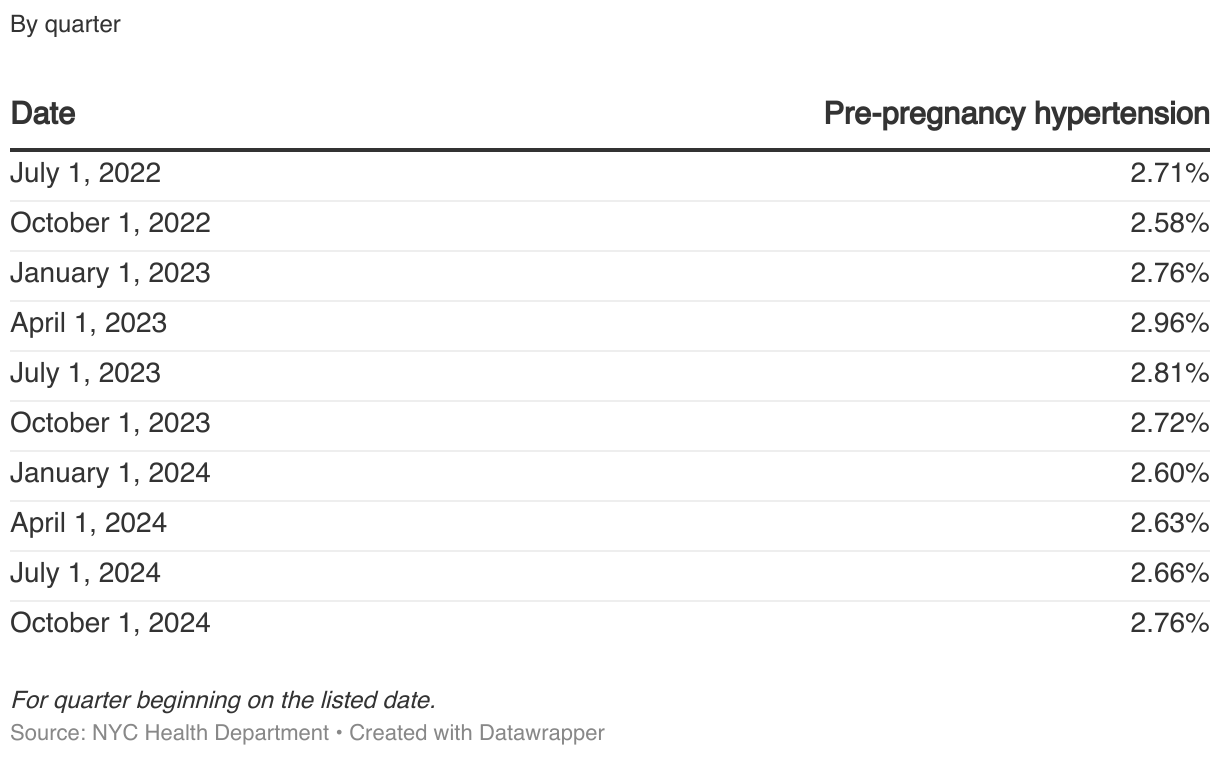
Pre-pregnancy hypertension
Usually, under 3% of mothers have pre-pregnancy hypertension, which can be a risk factor for poor birth outcomes.
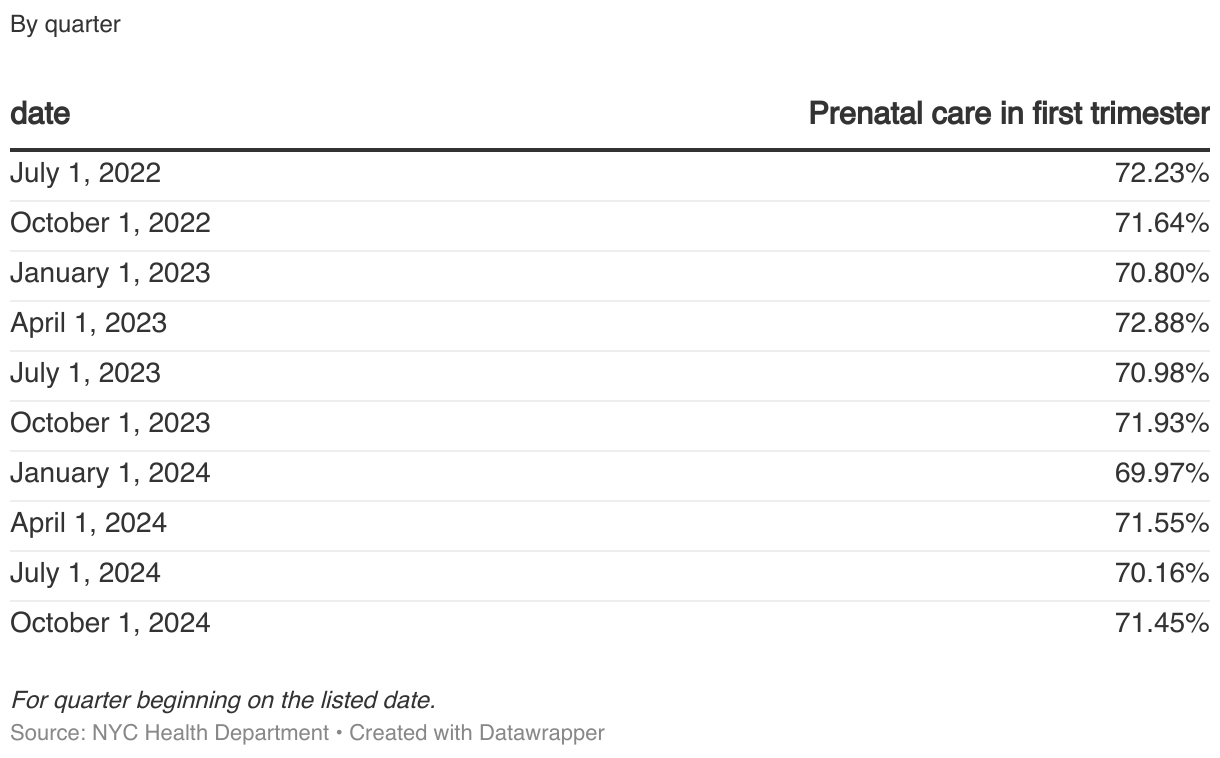
Prenatal care in the first trimester
About 70% of mothers receive prenatal care starting in the first trimester. This can be a protective factor against poor birth outcomes.
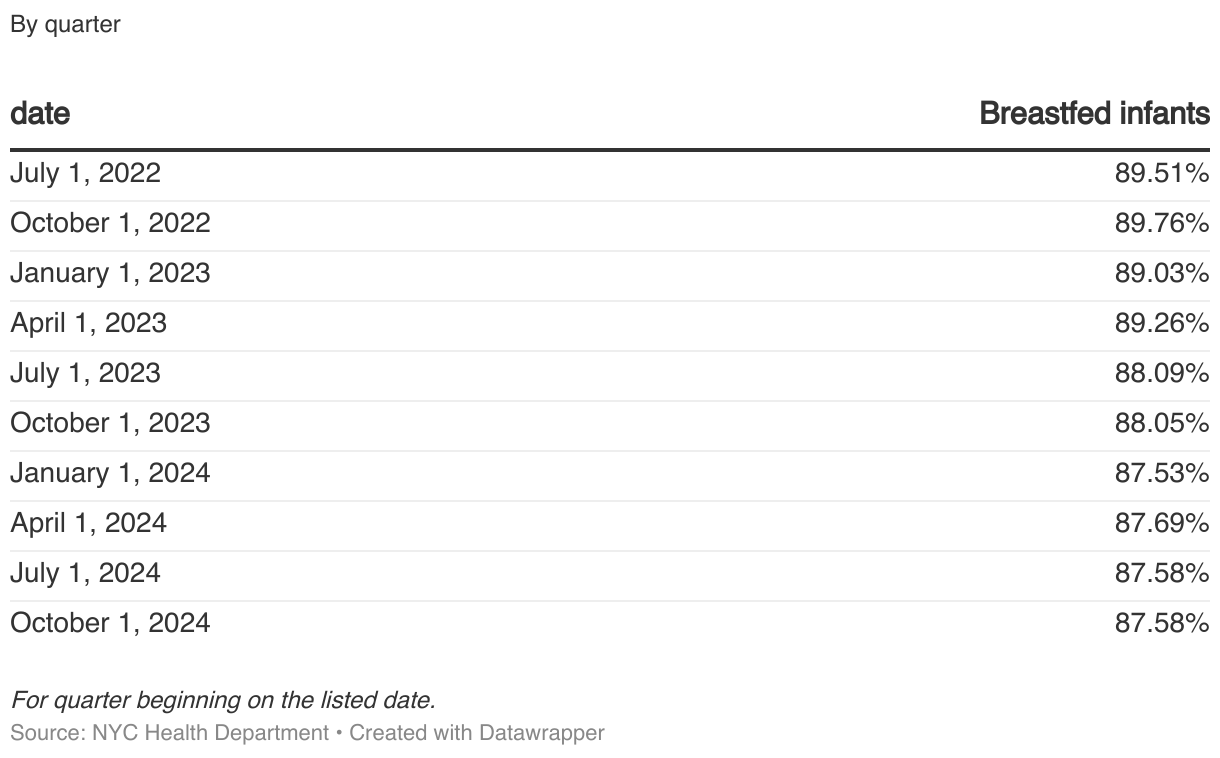
Breastfed infants
Usually, almost 90% of infants are breastfed in the first few days after birth. This can benefit the health of the person who gave birth and their baby. These numbers only represent breastfeeding that happened during the first few days of birth as collected at the hospital or health care facility.
Death Data
Data on deaths come from death certificates. The Health Department collects information about all deaths that occur in New York City, even among people who are not residents of NYC. The two death sections below include quarterly provisional data on infant mortality and deaths among all ages, with details on demographics and causes of death.
Deaths
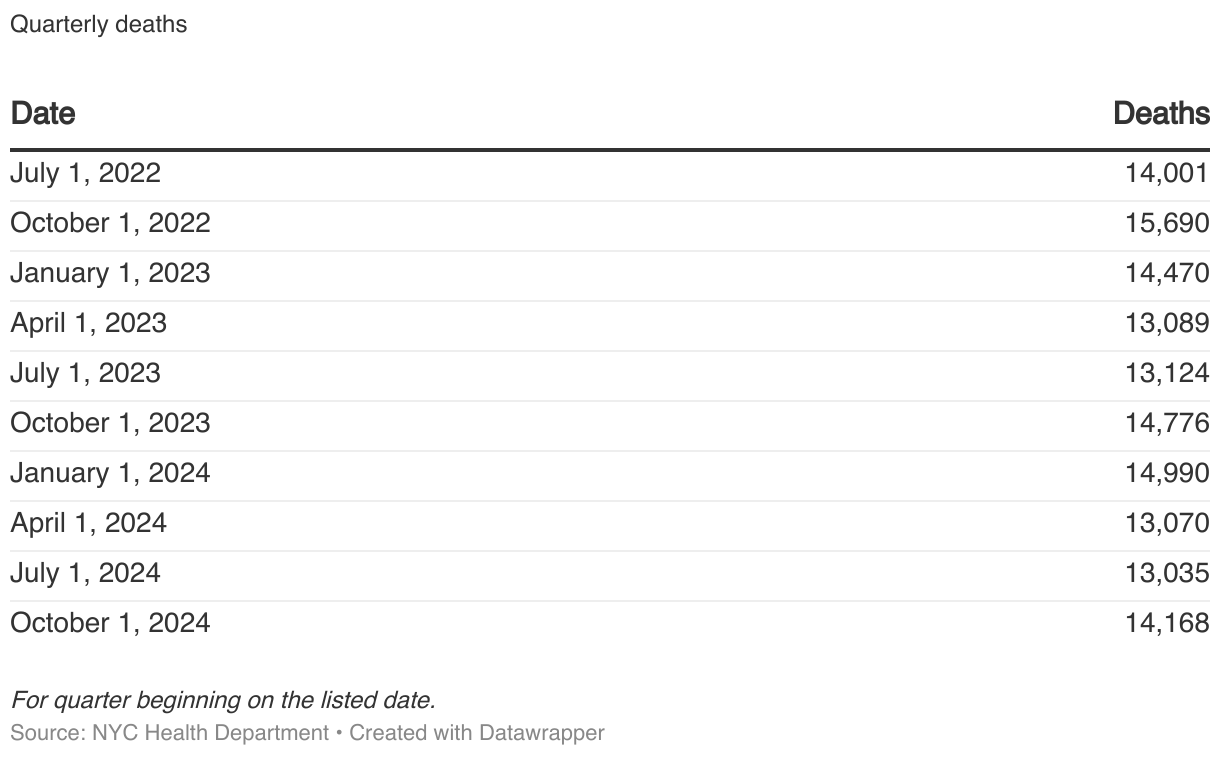
Total deaths
Usually, there are about 15,000 deaths in New York City each quarter, with a slight seasonal pattern.
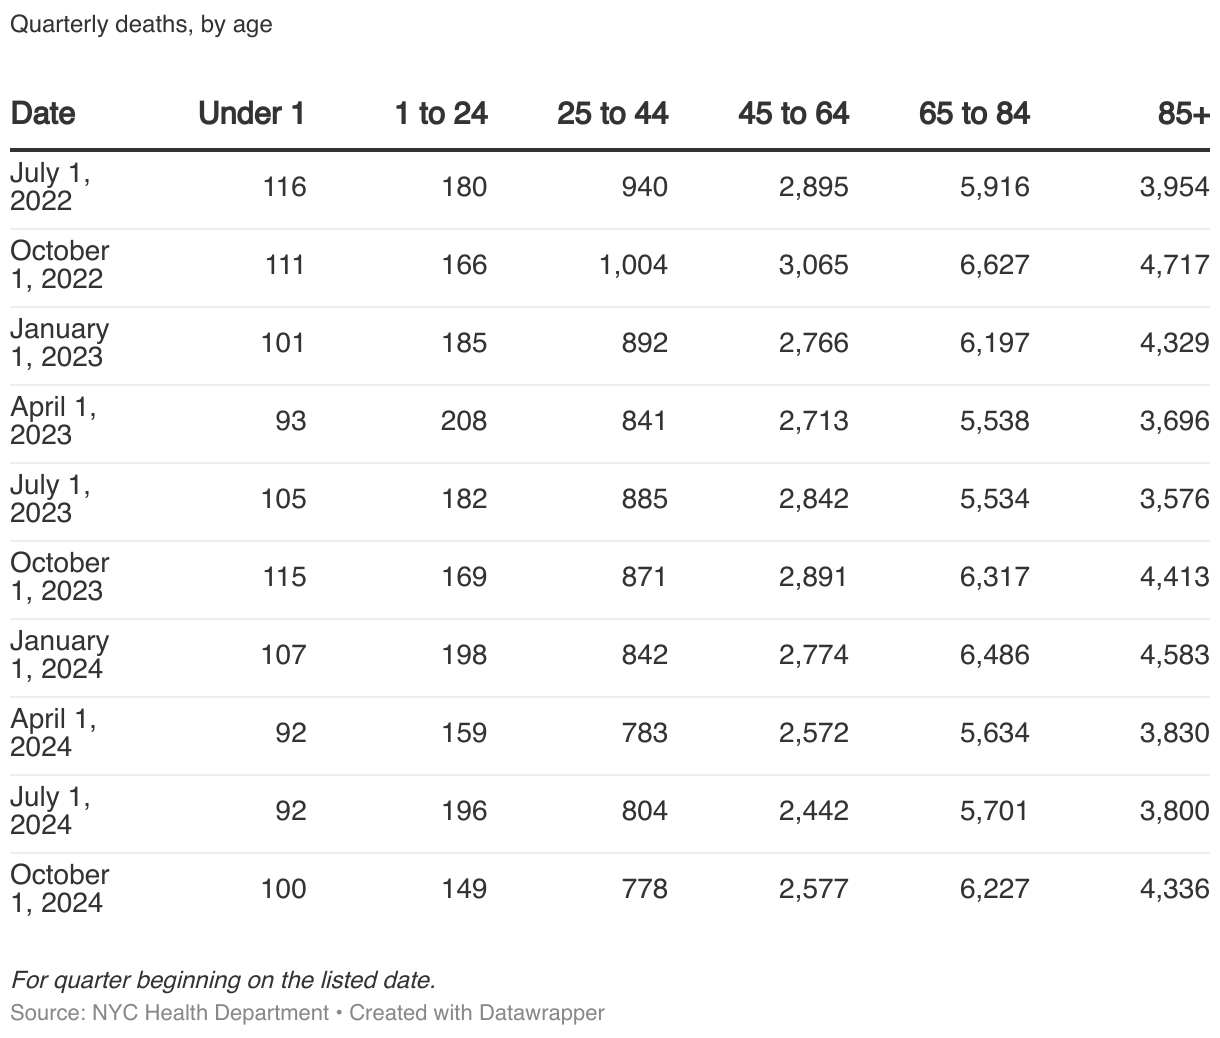
Deaths by age
Counts should not be used to make comparisons between groups, since the population sizes are not the same. For example, the group with the most deaths may not have the highest death rate. Fluctuations in counts do not necessarily show a meaningful trend.
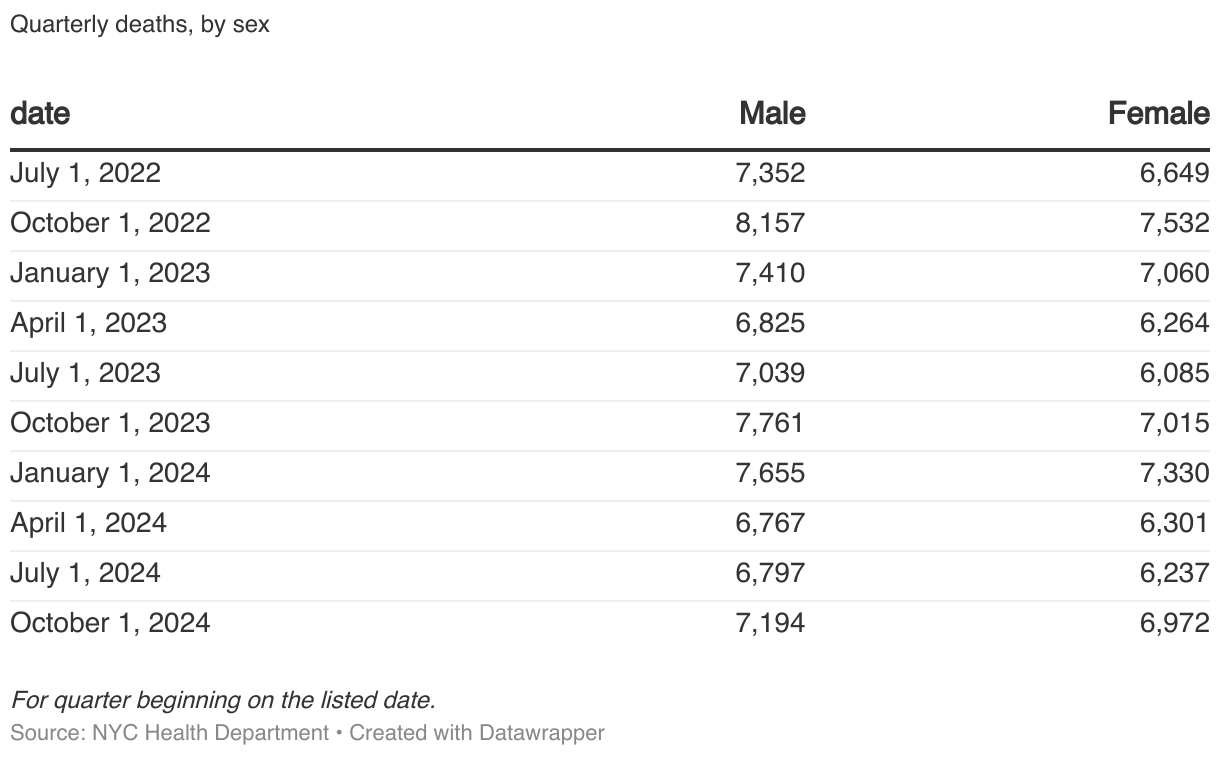
Deaths by sex
Counts should not be used to make comparisons between groups, since the population sizes are not the same. For example, the group with the most deaths may not have the highest death rate. Fluctuations in counts do not necessarily show a meaningful trend.
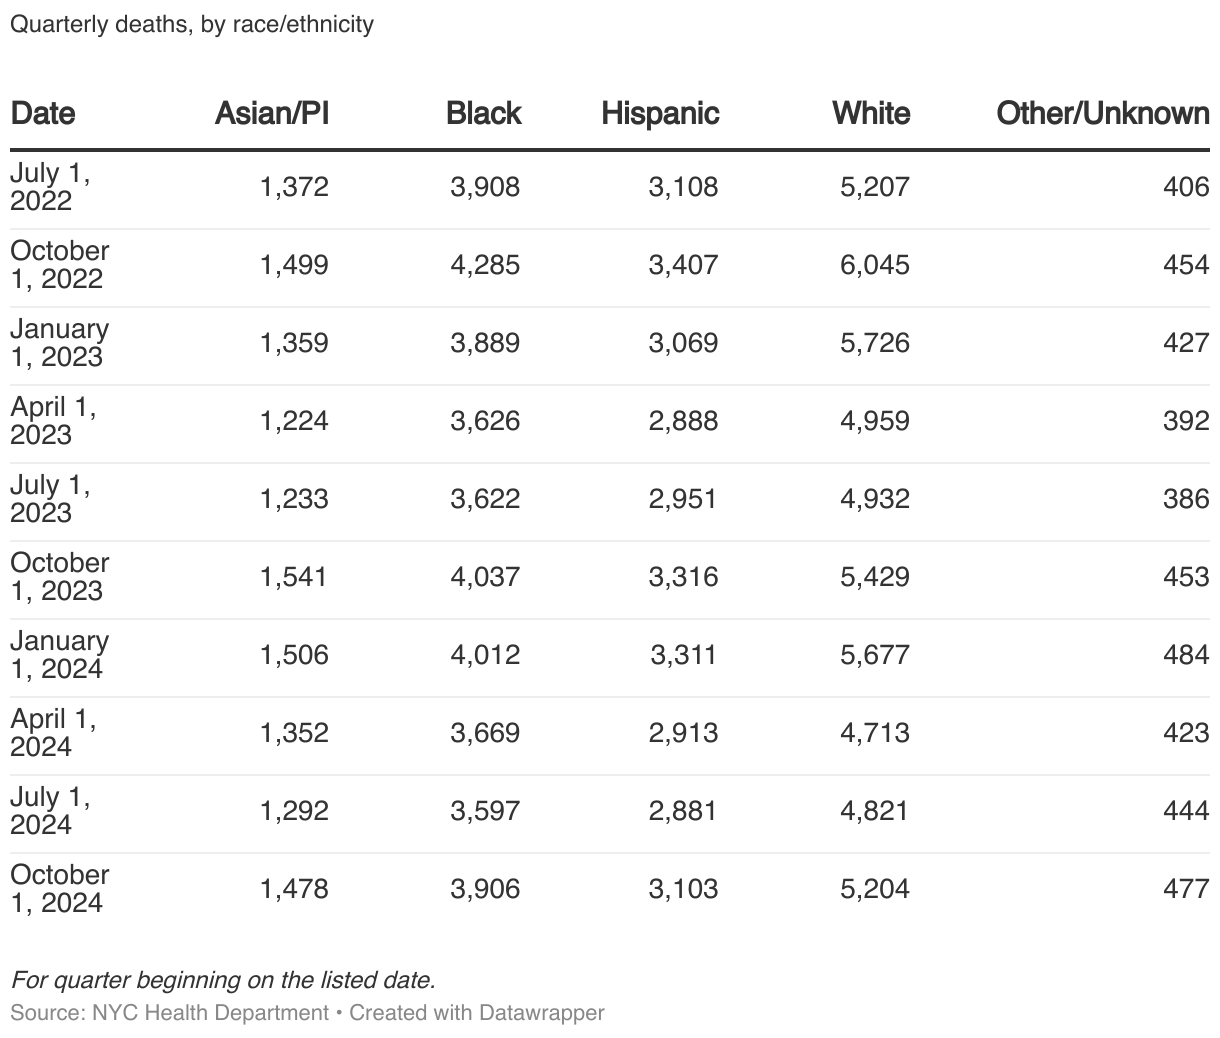
Deaths by race/ethnicity
Counts should not be used to make comparisons between groups, since the population sizes are not the same. For example, the group with the most deaths may not have the highest death rate. Fluctuations in counts do not necessarily show a meaningful trend.
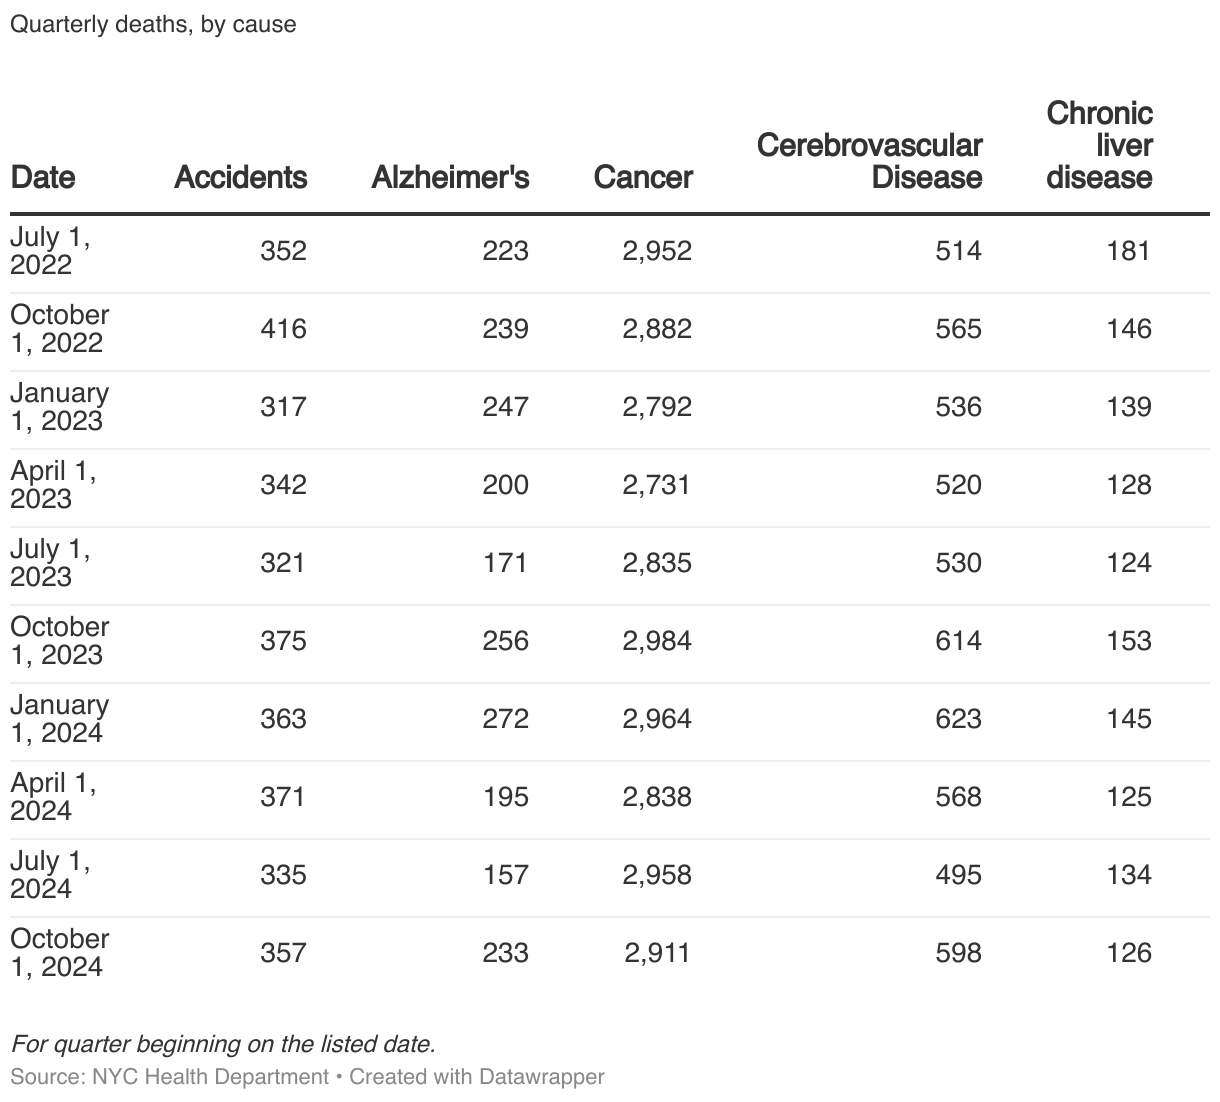
Deaths by cause
Selected causes of death are shown above, including both leading causes of death as well as causes that are priorities for the Health Department.
Infant Mortality Rates
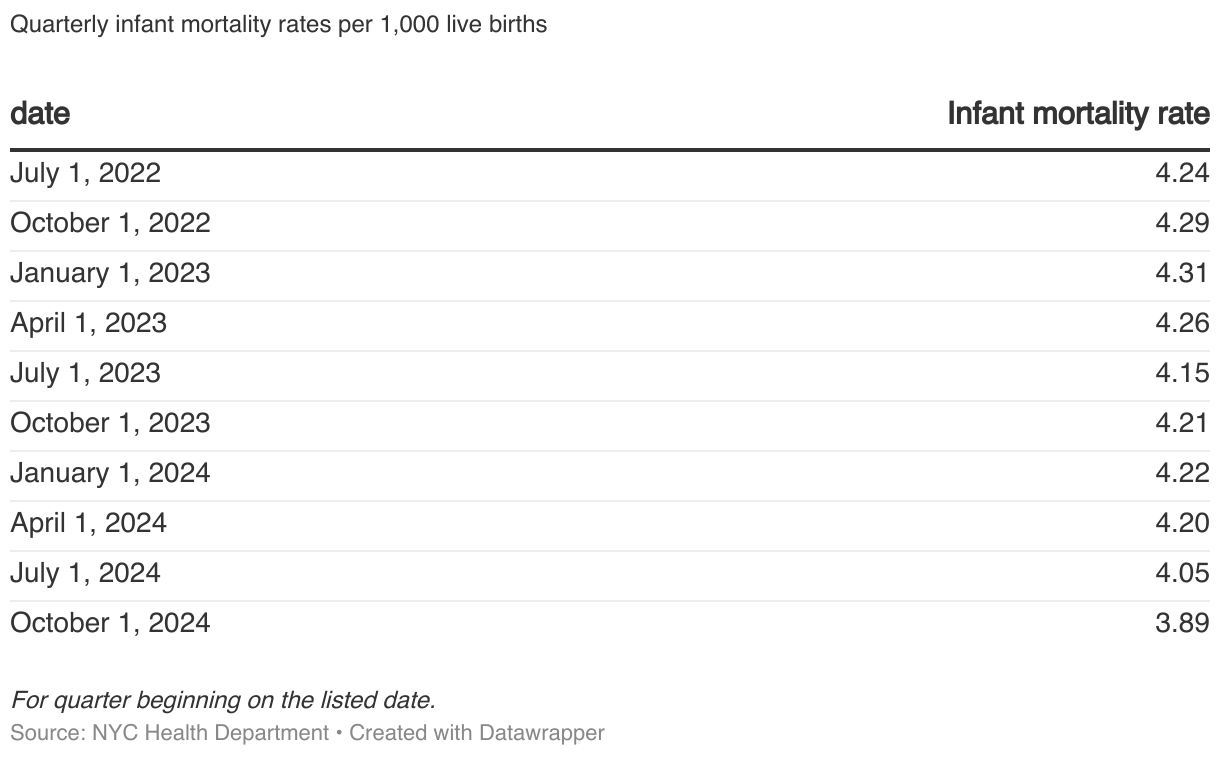
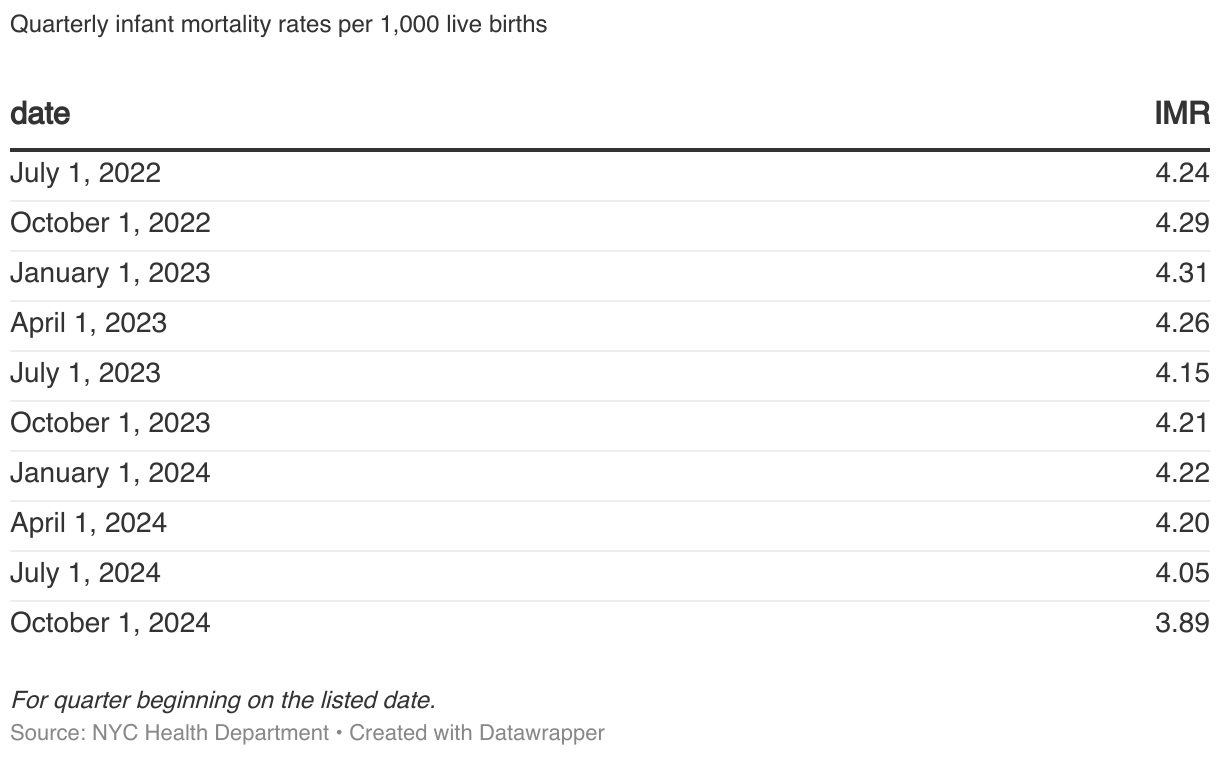
Infant mortality
Infant mortality rates are the number of infant deaths (less than 1 year of age) per 1,000 live births. Due to the small number of infant deaths, rates can fluctuate. All infant mortality data are shown as four-quarter rolling averages, meaning one quarter's data is averaged with the data from the three previous quarters.
Data on maternal mortality are available at HealthyNYC
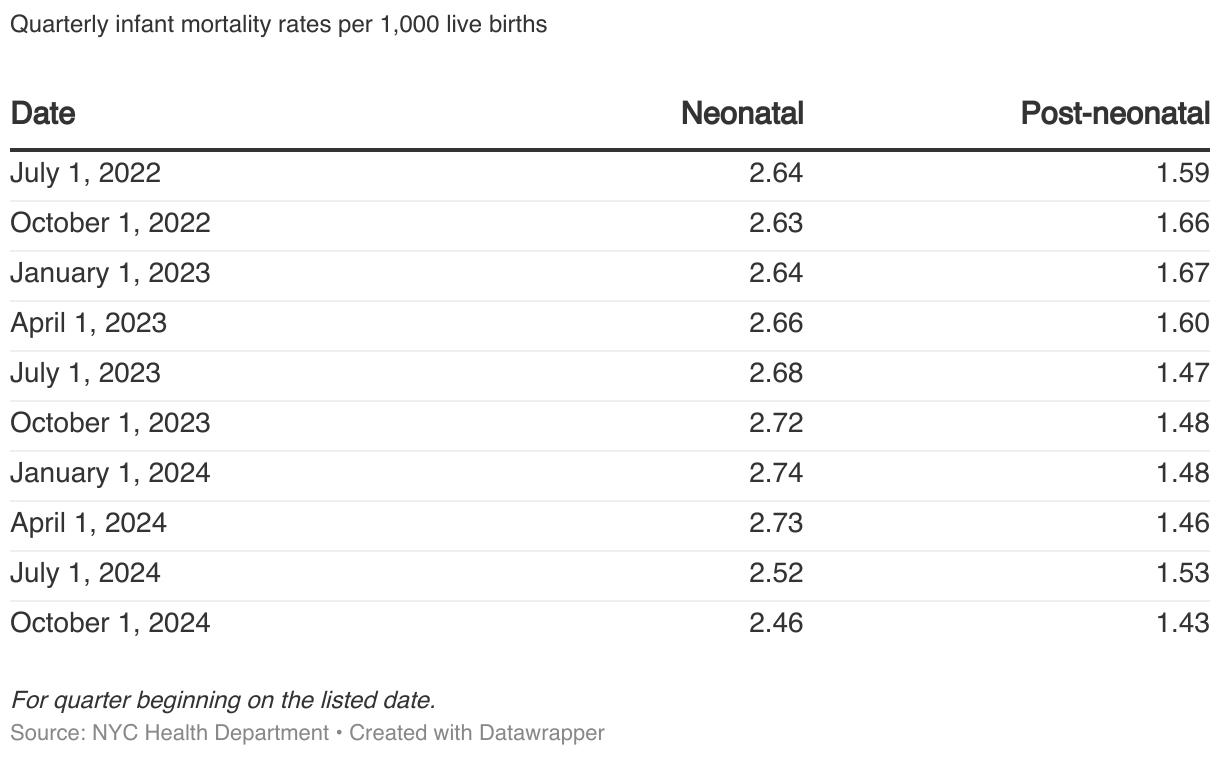
Infant mortality by age
There is usually a higher neonatal infant mortality rate—deaths among infants less than 28 days old. Deaths are post-neonatal if the baby is at least 28 days old but less than 1 year old. Due to the small number of infant deaths, rates can fluctuate. All infant mortality data are shown as four-quarter rolling averages, meaning one quarter's data is averaged with the data from the three previous quarters.
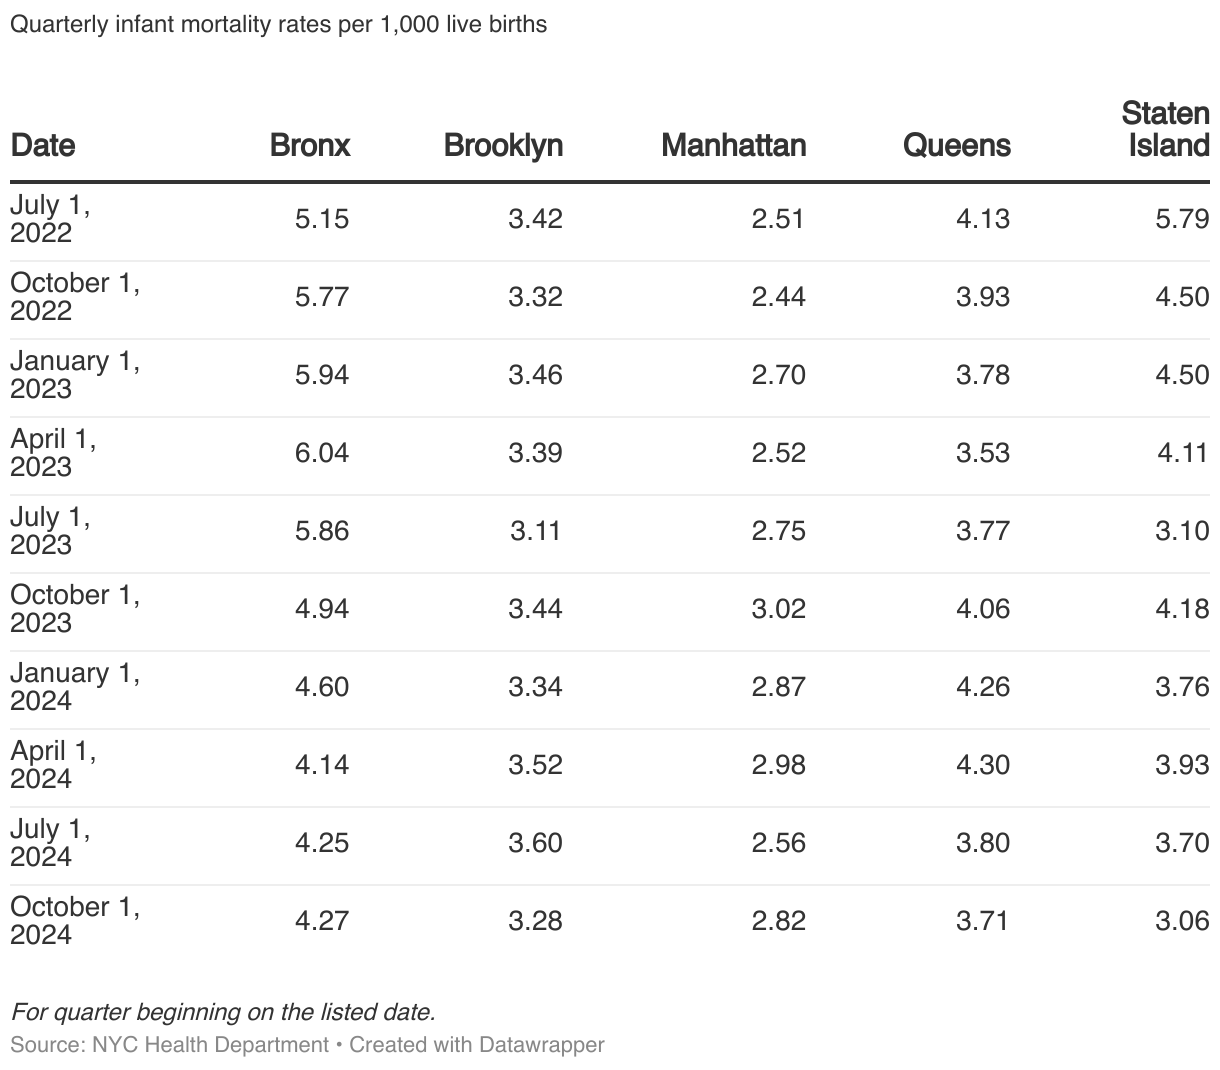
Infant mortality by borough
Due to the small number of infant deaths, rates can fluctuate. All infant mortality data are shown as four-quarter rolling averages, meaning one quarter's data is averaged with the data from the three previous quarters.
Infant mortality by race/ethnicity
Due to the small number of infant deaths, rates can fluctuate. All infant mortality data are shown as four-quarter rolling averages, meaning one quarter's data is averaged with the data from the three previous quarters.
Additional Resources
Download these data at our Github repository:
Explore finalized birth and death data on EpiQuery:
More Information
- Vital Statistics Data
- Birth and Death Historical Data
- Cause of Death Quality
- Trainings and Resources
- HealthyNYC: New York City's Campaign for Healthier, Longer Lives
- Note: Recent years of data reported for HealthyNYC are provisional as well, and they often will not match the death counts presented here. HealthyNYC data are specific to NYC residents who died in NYC, whereas data presented here are based on occurrences in NYC regardless of resident status.