Citywide Overall Crime Continues to Drop in the First Month of 2019
February 5, 2019
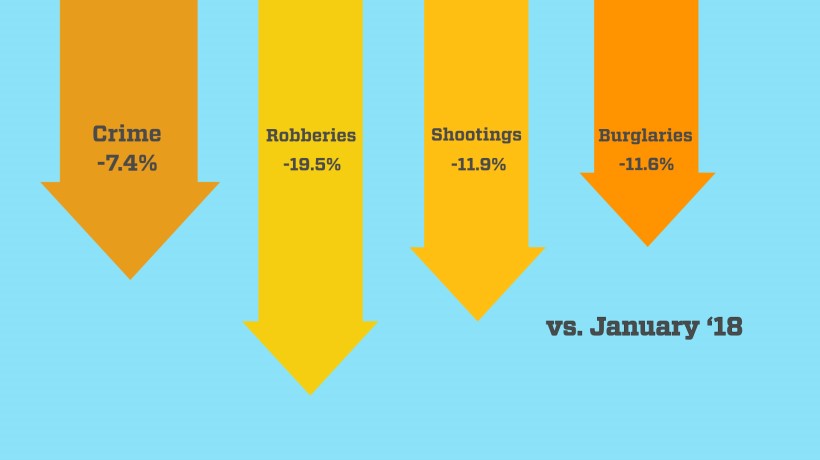
This January, New York City experienced 7.4% less index crimes than in January 2018 and it also marks the lowest number of index crimes in any previous January in the modern CompStat era. New York City also saw 11.9% fewer shootings than in January, 2018.
"New York City has seen massive overall reductions in violence and disorder over the past five, 10, 25 years," Police Commissioner James P. O'Neill said. "But we have a moral obligation to improve on our past success, and we will not stop until every street, in every neighborhood, is as safe as our safest streets already are today. That is our pledge: To ensure that all neighborhoods are safe, regardless of where the people we serve call home. Because your zip code should never be the determining factor when it comes to your safety."
"Every New Yorker deserves to feel safe in their home. While crime is at a historic low across the city, this is unfortunately not the reality in every neighborhood," said Mayor Bill de Blasio. "We are doubling down on our efforts to bring these communities and police together to find new ways to fight crime and make our City safer and fairer."
Key highlights from this month’s crime statistics include:
- Record low index crimes in January 2019 (7,072), compared to January 2018 (7,638) marking the lowest number of index crimes in any January in the CompStat era.
- Transit crime down -1.5% in January 2019 compared to January 2018.
- Shooting incidents down -11.9% in January 2019 compared to January 2018.
- Robberies, felony assaults, burglaries, and grand larcenies all down -19.5%, -7.9%, -11.6%, -2.4% in January 2019 compared to January 2018 respectively; record low robberies in a January in the modern CompStat era.
The Police Commissioner made this announcement in the 73 precinct, one of the six precincts that at the end of 2018 had violent crime rates more than twice as high as the rest of the City.
The precincts include: 73, 75, 40, 41, 42, 25. Through Neighborhood Policing and this targeted effort, the NYPD is focused on ensuring zip code is never the determining factor when it comes to safety. “Additionally, the first meeting to identify strategies and resources that will be newly deployed to bring crime down will take place tomorrow, February 6, in the 73 precinct.
(Note: Monthly and Year-to-Date numbers are the same since it is the first month of the year.)
| Jan. 2019 | Jan. 2018 | Change | +/-% | Year-to-Date 2019 | Year-to-Date 2018 | Change | +/-% | |
|---|---|---|---|---|---|---|---|---|
| Murder | 27 | 22 | +5 | -22.7% | 27 | 22 | +5 | +22.7% |
| Rape | 150 | 118 | +32 | +27.1% | 150 | 118 | +32 | +27.1% |
| Robbery | 922 |
1,146 | -224 | -19.5% | 922 |
1,146 | -224 | -19.5% |
| Felony Assault |
1,416 | 1,537 | -121 | -7.9% | 1,416 | 1,537 | -121 | -7.9% |
| Burglary | 888 | 1,005 | -117 | -11.6% | 888 | 1,005 | -117 | -11.6% |
| Grand Larceny |
3,314 | 3,397 | -83 | -2.4% | 3,314 | 3,397 | -83 | -2.4% |
| G.L.A. | 335 | 413 | -58 | -14% | 355 | 413 | -58 | -14% |
| TOTAL | 7,072 | 7,638 | -566 | -7.4% | 7,072 | 7,638 | -566 | -7.4% |
Additional Statistics on Crimes 2017-2018
| Nov. 2018 | Nov. 2017 | Change | +/-% | Year-to-Date 2018 | Year-to-Date 2017 | Change | +/-% | |
|---|---|---|---|---|---|---|---|---|
| Transit | 196 | 199 |
+3 | -1.5% | 196 | 199 |
-3 | -1.5% |
| Housing | 357 | 401 | -44 | -11% | 357 | 401 | -44 | -5.6% |
| Shooting Incidents | 52 | 59 | -7 | -22.2% | 52 | 59 | -7 | -22.2% |
January Rape Breakdowns
| CompStat Year | Count | Occurred Same Year | Occurred Previous Year | Occurred 2 Years Prior | Occurred 3 Years Prior | Occurred 4 Years Prior | Occurred 5+ Years Prior |
|---|---|---|---|---|---|---|---|
| 2019 |
150 |
81 |
44 |
7 |
4 |
4 |
10 |
| 2018 | 118 |
59 |
33 |
8 |
4 |
0 |
14 |
| 2017 | 108 |
65 |
27 |
5 |
2 |
1 |
8 |
| 2016 | 101 | 62 | 26 | 4 | 1 | 1 | 7 |
| 2015 | 113 | 66 | 34 | 5 | 2 | 2 | 4 |
| 2014 | 114 | 76 | 25 | 4 | 2 | 1 | 6 |
Note: All crime statistics are preliminary and subject to further analysis, revisions, or change.
###


