 Department of City Planning311
 Search all NYC.gov websites
Regional Planning

NYC Metro Region Employment Tracker
The interactive NYC Metro Region Employment Tracker shows county, subregion, and metropolitan area employment and wage trends across different industries. Its Geographic Comparison feature allows you to compare job trends within the region and against the U.S. as a whole. The tracker is updated quarterly.
Life Sciences in the NYC Metro
Life Sciences in the NYC Metro, is a first-of-its-kind report demonstrating the strength and scale of our region’s life sciences economy—an innovation ecosystem centered around NYC with more than a dozen hubs in New York, New Jersey, and Connecticut well-connected by regional transit. Looking at jobs and businesses, talent, investment, and real estate, the report demonstrates that the NYC Metro is a life sciences powerhouse, collectively the largest metro life sciences economy in the nation.
NYC Metro Region Explorer
The NYC Metro Region Explorer, an interactive map showing population, housing, and employment trends within the metro region, has been updated to include New York City in- and out- commuting data. The tool also shares key insights about how our region has changed from 2000 to today
NYC Metro 2020 Housing Production Snapshot

The metro region under-produced housing in the last decade, even though construction activity held steady in 2020. To learn more about where and what kind of new housing is being built in our region, check out this two-page brief, or read more this edition of NYC Thinking Regionally.
Census 2020: Trends in NYC and the Metro Region

Interested in how and where New York City and the metro region has grown, aged, and become more diverse since 2010? You can view this webinar where NYC Department of City Planning (DCP) analysts provided insights into the 2020 Census results (slides only here), and also read more about the region’s demographic trends in our August 2021 and October 2021 editions of the NYC Thinking Regionally.
NYC Metro: Tracking the Recovery Dashboard
National Institutes of Health (NIH) Funding Map

Covid-19 and NYC Metro Region Residential Sales Trends

The Covid-19 and NYC Metro Region Residential Sales Trends research brief examines patterns in home listings, sales, and prices in the metro region in the months prior to and since the pandemic. It highlights the pressures, exacerbated by Covid-19, on residential markets outside of New York City and suggests a troubling direction for the metro region's housing availability and affordability.
NYC Metropolitan Regional Telework Capability Portal

The NYC Metropolitan Region Telework Capability Portal allows you to explore various metrics, by municipality, that characterize residents’ and employers’ tendency to perform jobs remotely.
The Geography of Jobs

The Geography of Jobs series analyzes employment, industry, labor force, and housing development trends and describes the shifting geography of growth throughout New York City, northern New Jersey, Long Island, the Hudson Valley, and southwest Connecticut. You can read the first edition, published in 2018, here and the second edition, published a year later and with more in-depth analysis here.
The Ins and Outs of NYC Commuting

The Ins and Outs of NYC Commuting report analyzes recent trends and characteristics of workers traveling to New York City for employment (in-commuters), as well as New York City residents traveling elsewhere in the metro region for employment (out-commuters) and examines changes in commuting patterns since 2000.
Port Authority Bus Terminal Testimony

OneNYC highlights the urgent need for multiple regional strategies to address the growing number of commuters arriving to New York City from across the Hudson River. The ability to draw workers from across the metro region has long contributed to New York City’s success. DCP believes the Port Authority Bus Terminal replacement is a significant step in the right direction. Read New York City’s full comments on the project here.
Where We Live NYC

New York City—like all cities in the United States—is scarred by a long history of discrimination, segregation and injustice. That history has particularly affected neighborhoods in which people of color make up the majority of the population. A holistic approach to advancing fair housing requires substantial investments and policy changes to address the structural disadvantages that these neighborhood and their residents experienced. Read the full fair housing plan here.
Sustainable Communities Regional Planning Grant Program

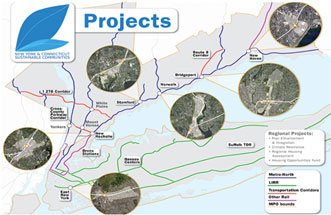
The New York-Connecticut Sustainable Communities Consortium was awarded $3.5 million in funding under the inaugural year of HUD’s Sustainable Communities Regional Planning Grant Program. For the first time in history, HUD has awarded nearly $100 million in new grants to support more livable and sustainable communities across the country.
To return to DCP’s Regional Planning overview page here.


